Chicago Homicides Down Nearly 50% and the Gains Are Citywide
Author
B. Robert Owens
Civic Committee of the Commercial Club of Chicago
John K. Roman
NORC at the University of Chicago
May 2026
As Chicago experiences one of its sharpest homicide declines in decades, neighborhood- and tract-level data can show where violence is falling, where serious risks remain, and how police and community violence prevention programs can achieve the greatest effect.
Recent violent crime reductions in Chicago and nationwide have been historic. Homicides in Chicago have dropped dramatically since the recent peak in 2021, when there were 780 homicide incidents. By the end of 2025, homicides had declined by almost half (47.7 percent), including a 27.5 percent decline between 2024 and 2025.
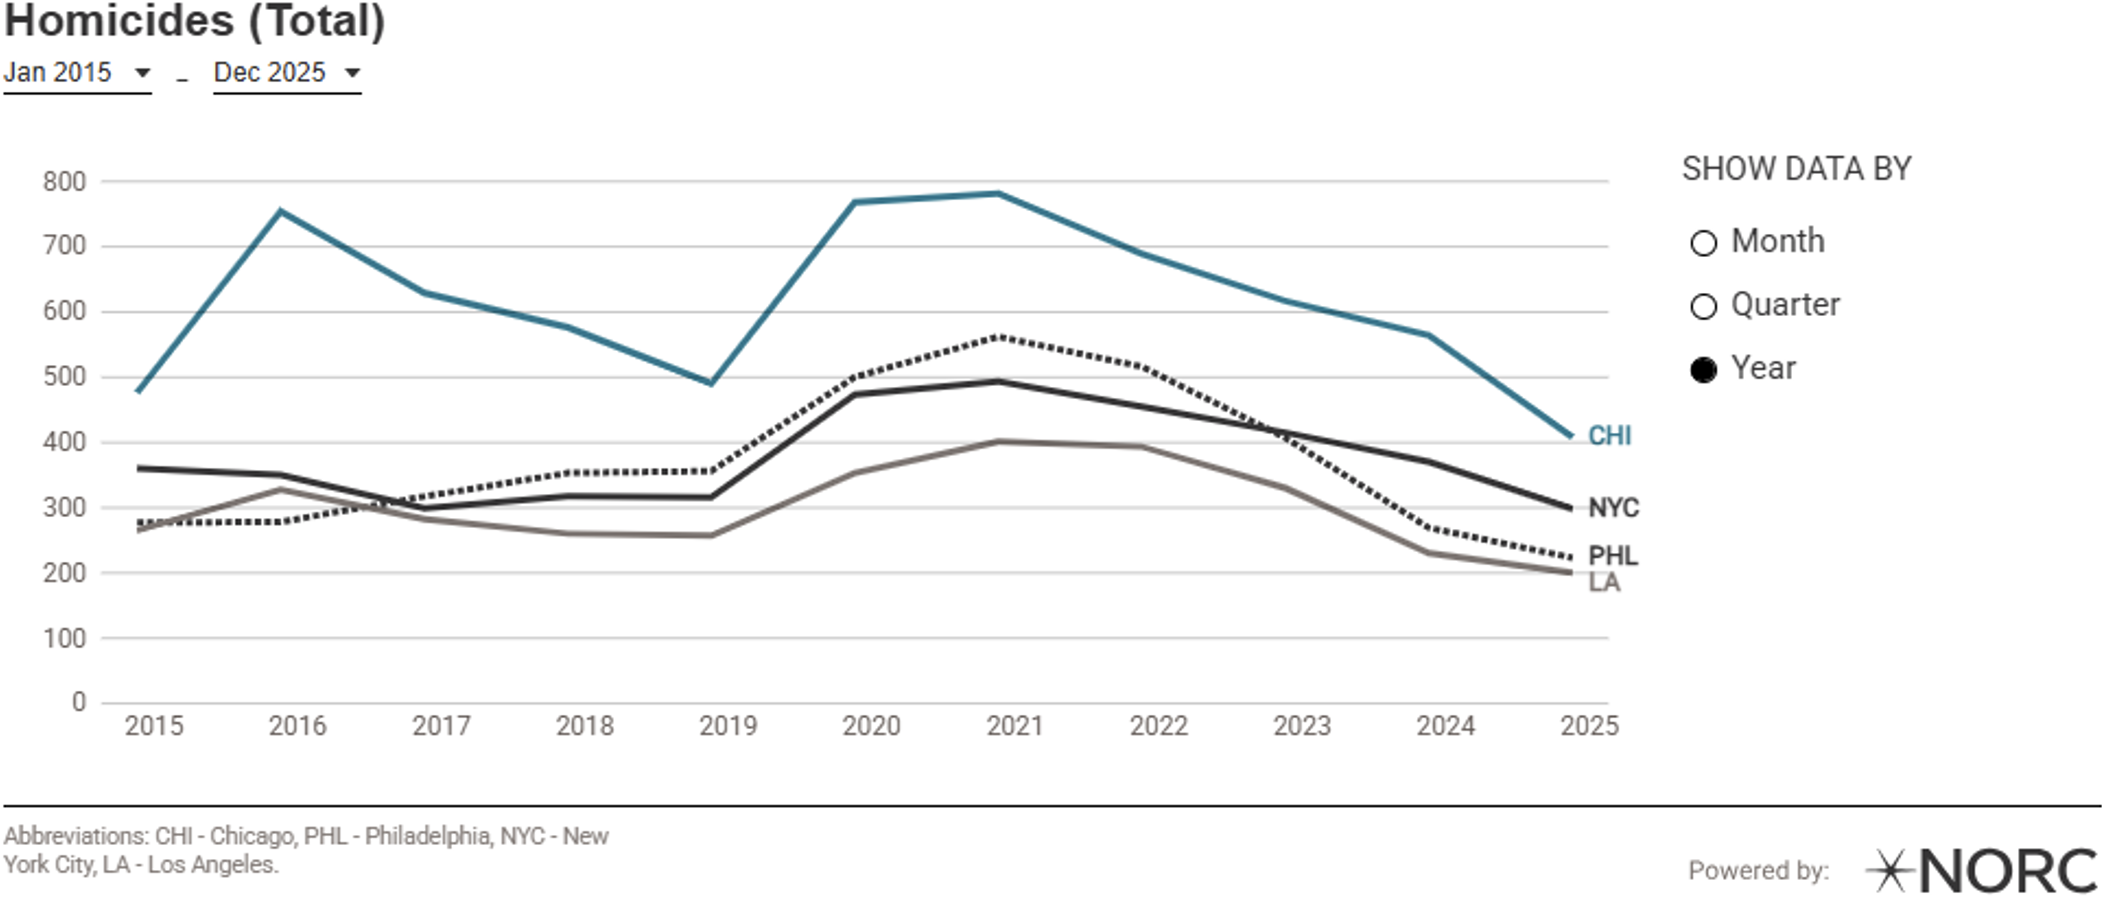
Figure 1. Annual homicides in Chicago, 2015–2025, captured from this website’s Violent Crime Trends visualization.
While city-level changes are important indicators of broad trends, research across many cities consistently shows that violence tends to concentrate in a small proportion of blocks. Chicago fits the pattern. For years, Chicago’s violent crime has been concentrated in a relatively small number of places and persistent in many of the same places year after year. Over the past 10 years in Chicago, 79 percent of homicides have been concentrated in the 20 most violent Community Areas, despite these neighborhoods representing only 29 percent of the city population.
Nearly every high-violence community in Chicago saw reductions in homicides in 2025. Figure 2 shows that most such communities exceeded the citywide reduction of 28.4 percent. Some of those that did not, notably Austin, North Lawndale, and Humboldt Park, have seen dramatic declines over a slightly longer period. Among the high-violence communities, only two did not see large reductions in homicides between 2020 and 2025.
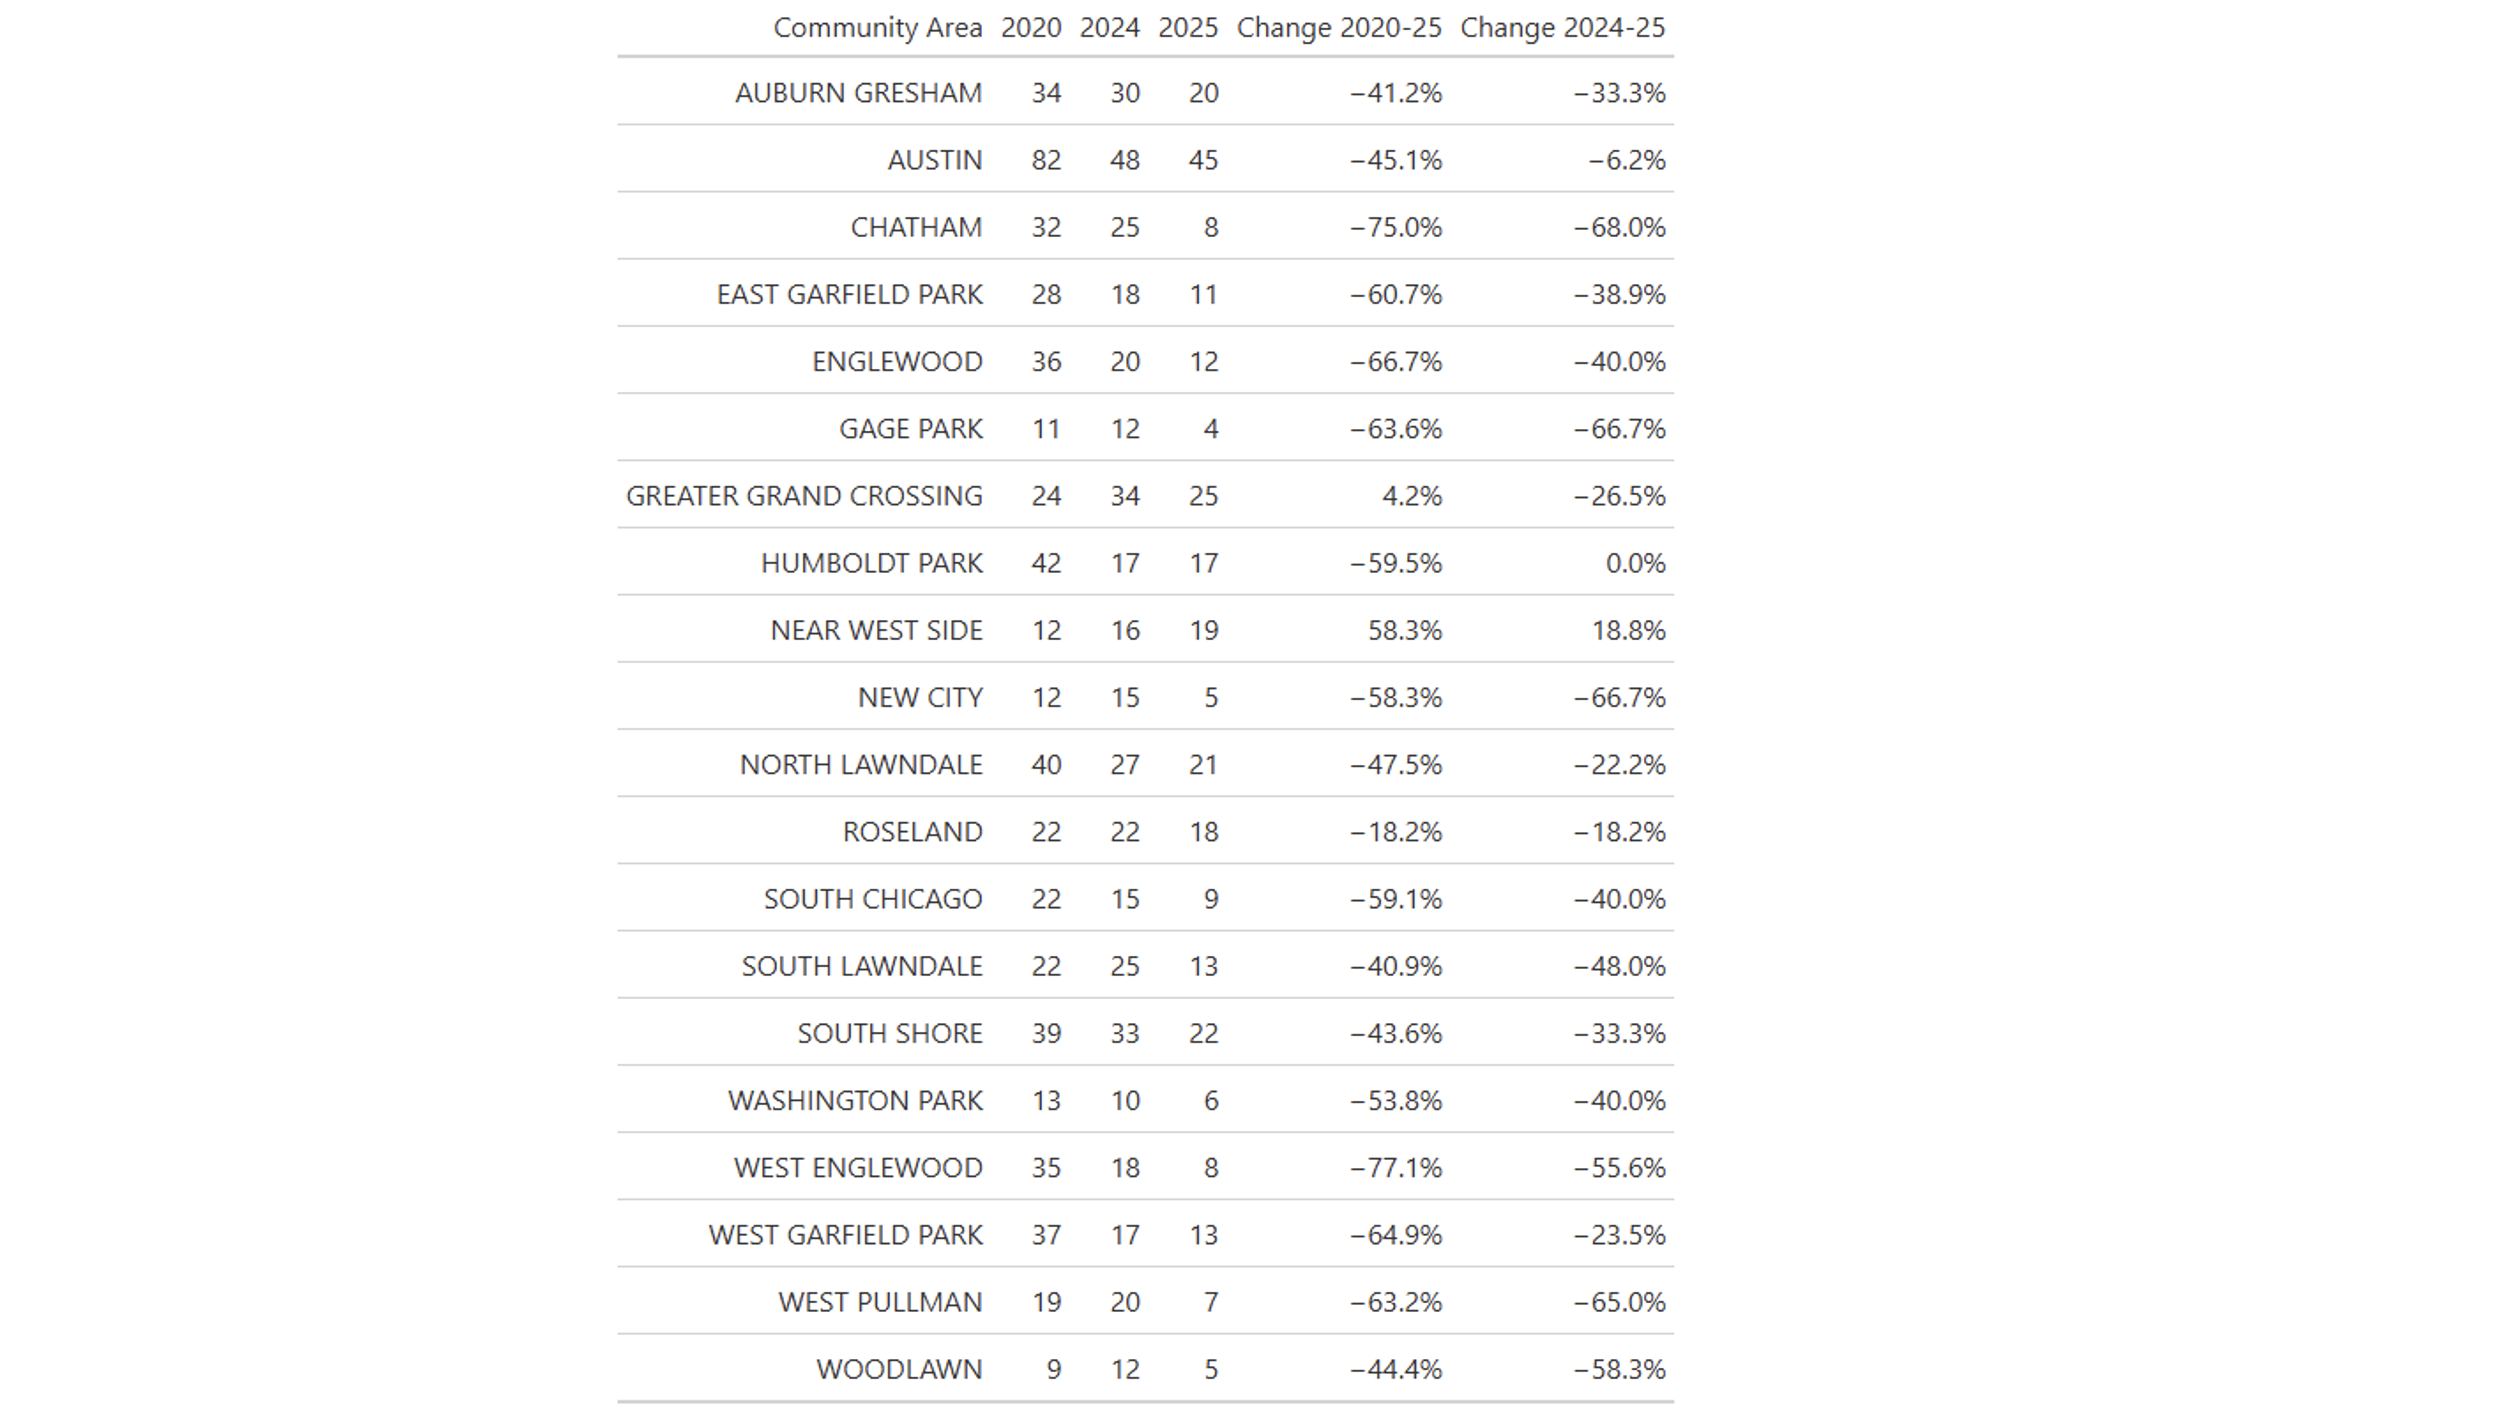
Figure 2. Trends in Chicago’s highest homicide Community Areas, 2020–2025
Safety gains were similarly widespread at the tract level. More than four in five of Chicago’s census tracts had fewer homicides in 2025 than their average for 2020–2024. This measurement includes tracts with no homicides in 2025, even if the 2020–2024 average was also zero, meaning there was no change.
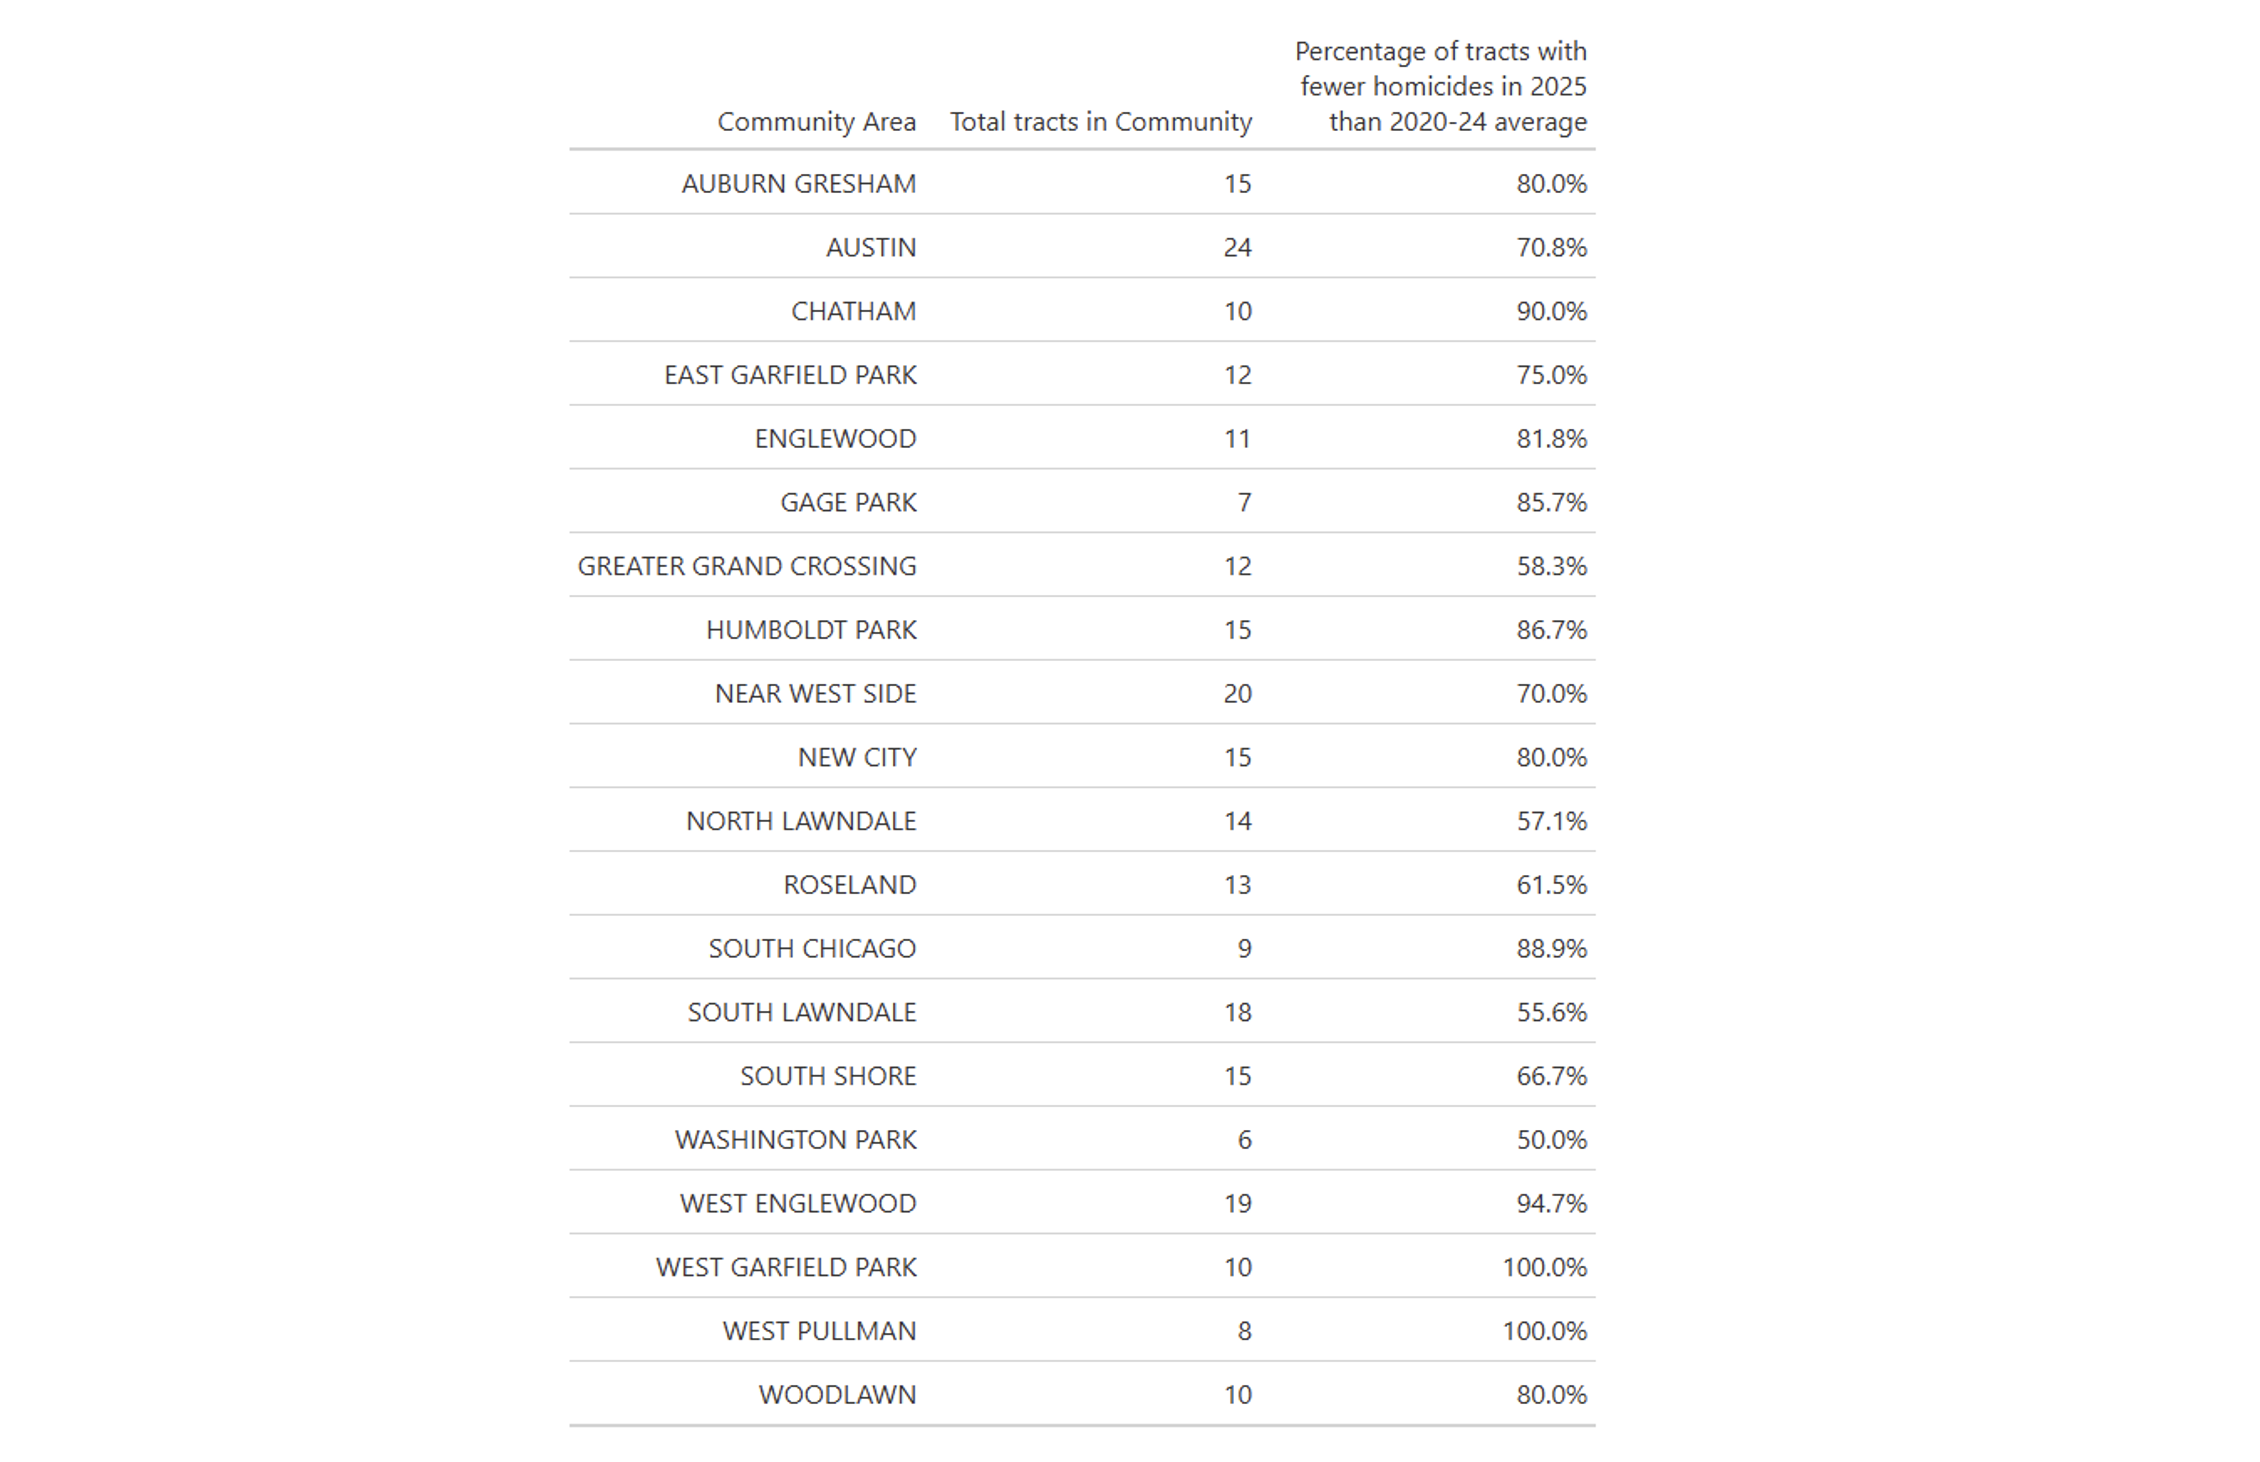
Figure 3. Share of census tracts in Chicago’s highest homicide Community Areas with fewer homicides in 2025 than previous 5-year average
For a deeper dive into one of these Community Areas, see Exploring Crime Data in Austin.