
Understanding Chicagoans’ Views on Public Safety
Creating safer, more trusting communities requires ongoing insight into how residents experience safety and justice in the city.
Efforts to reduce violent crime in Chicago are not just about improving safety—they also aim to help residents feel more secure in their daily lives. Similarly, strengthening the criminal justice system should foster greater public trust and confidence.
Trust in the police, the courts, and the broader justice system is essential for sustaining community cooperation and long-term public safety. When people believe that justice is applied fairly and transparently, they are more likely to engage with and support public safety efforts.
Chicago Trust & Safety Surveys
In Spring 2025, NORC surveyed city residents to gauge how Chicagoans perceive crime and safety issues. NORC conducted the survey using its probability-based ChicagoSpeaks™ panel, which provides affordable, trustworthy data on the opinions of Chicagoans. While the current levels of trust and perceived safety are informative, how those levels change over time will reveal whether the city is making progress toward the safer future that residents hope to see.
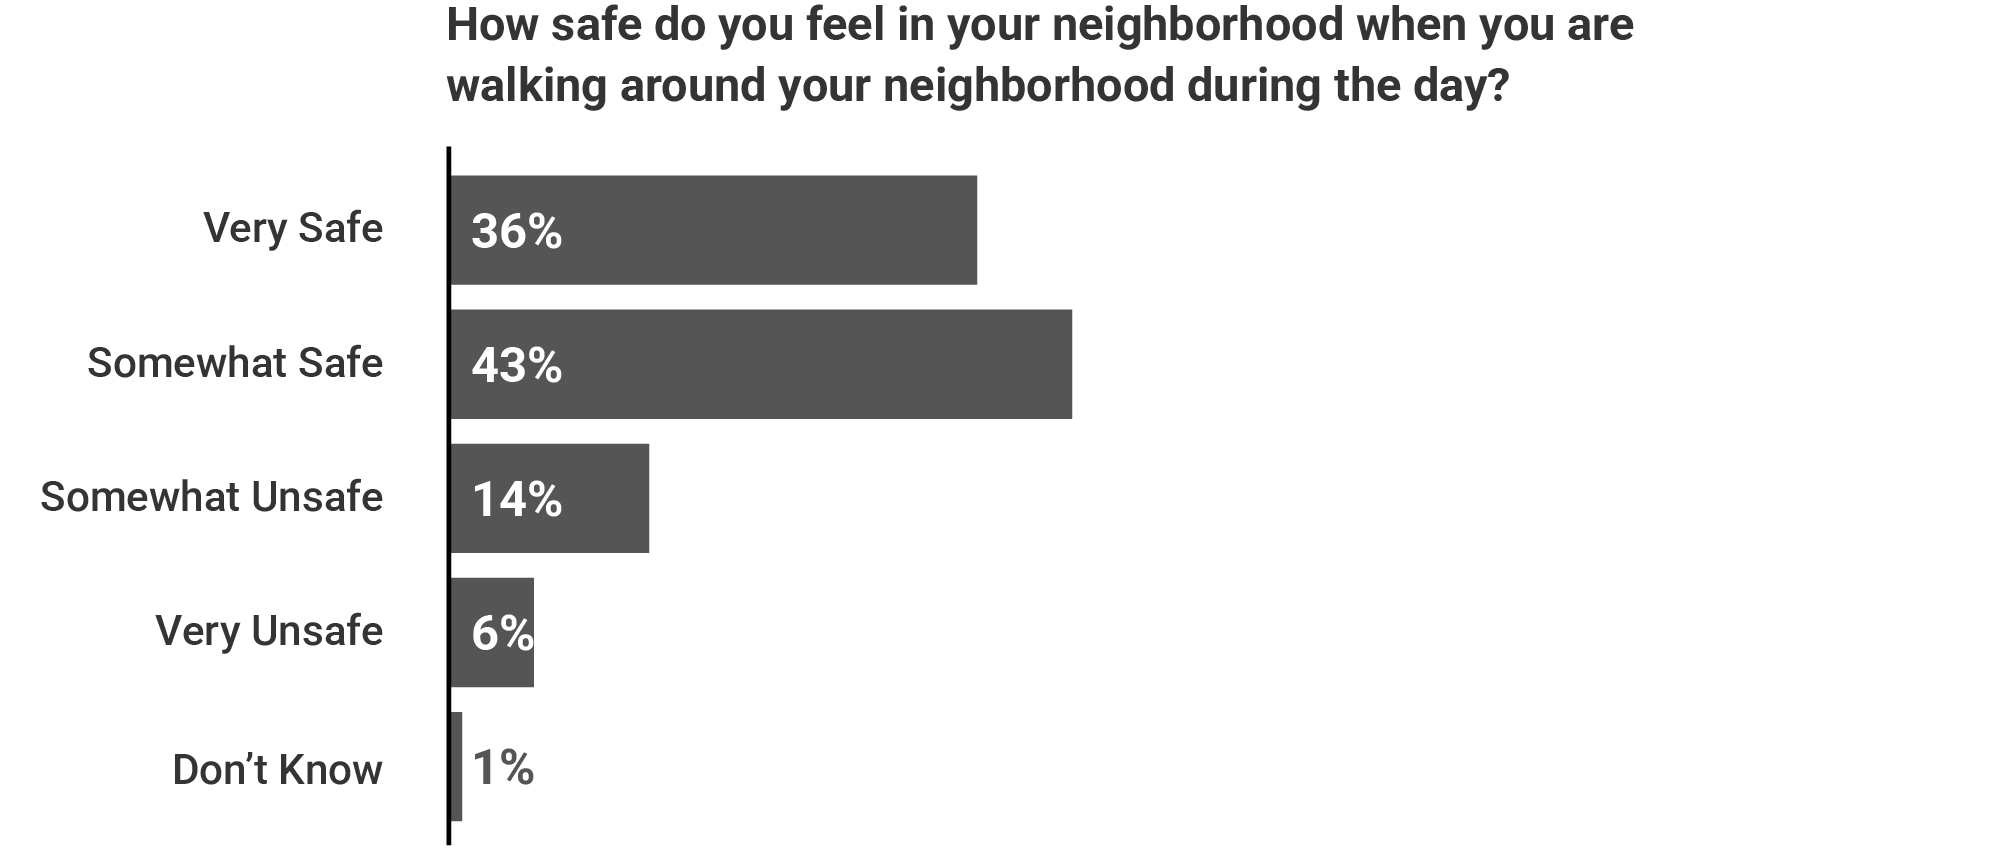
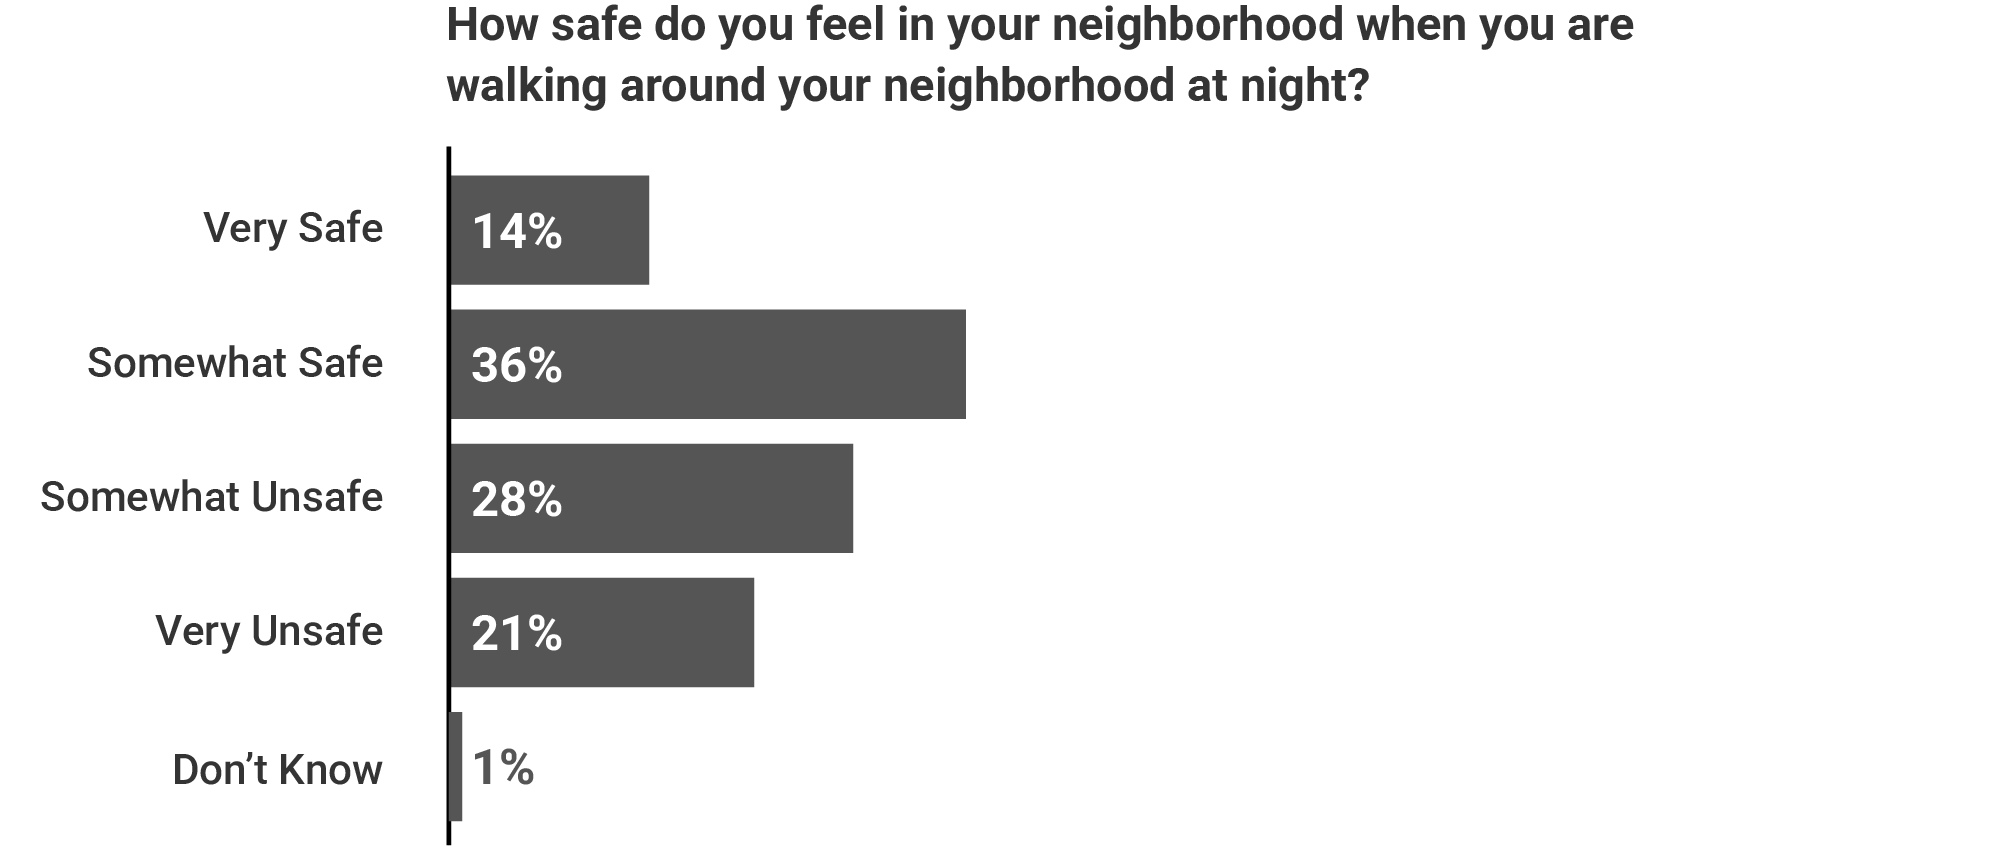
Neighborhood Safety
Most Chicagoans feel safe during the day and less safe at night and around strangers.
- 79 percent of residents report feeling very or somewhat safe in their neighborhoods during the day.
- 50 percent of residents feel very or somewhat safe in their neighborhood at night.
- 29 percent of residents feel very or somewhat safe in their neighborhood when a stranger stops them at night to ask for directions.
Feelings of safety at night remain unchanged since summer 2024 according to ChicagoSpeaks™ polls conducted in summer 2024, fall 2024, and spring 2025, with two-thirds of Chicagoans saying there is an area within one mile of their home where they would be afraid to walk alone at night.
But feelings of safety vary by gender, race, and geography.
- White residents (62 percent) feel significantly safer walking around their neighborhood at night than Black (36 percent) and Hispanic residents (44 percent).
- Residents of the North Central region (64 percent) feel safer walking around their neighborhood at night than residents in the South (34 percent), Southwest (44 percent), and West (46 percent) regions of the city.
- Men and women feel similarly safe at home during the day and at night. However, women feel less safe walking around their neighborhood during the day (75 percent), when approached by a stranger in the night (23 percent), and when they hear footsteps behind them (18 percent) than men (82 percent, 37 percent, and 39 percent respectively).
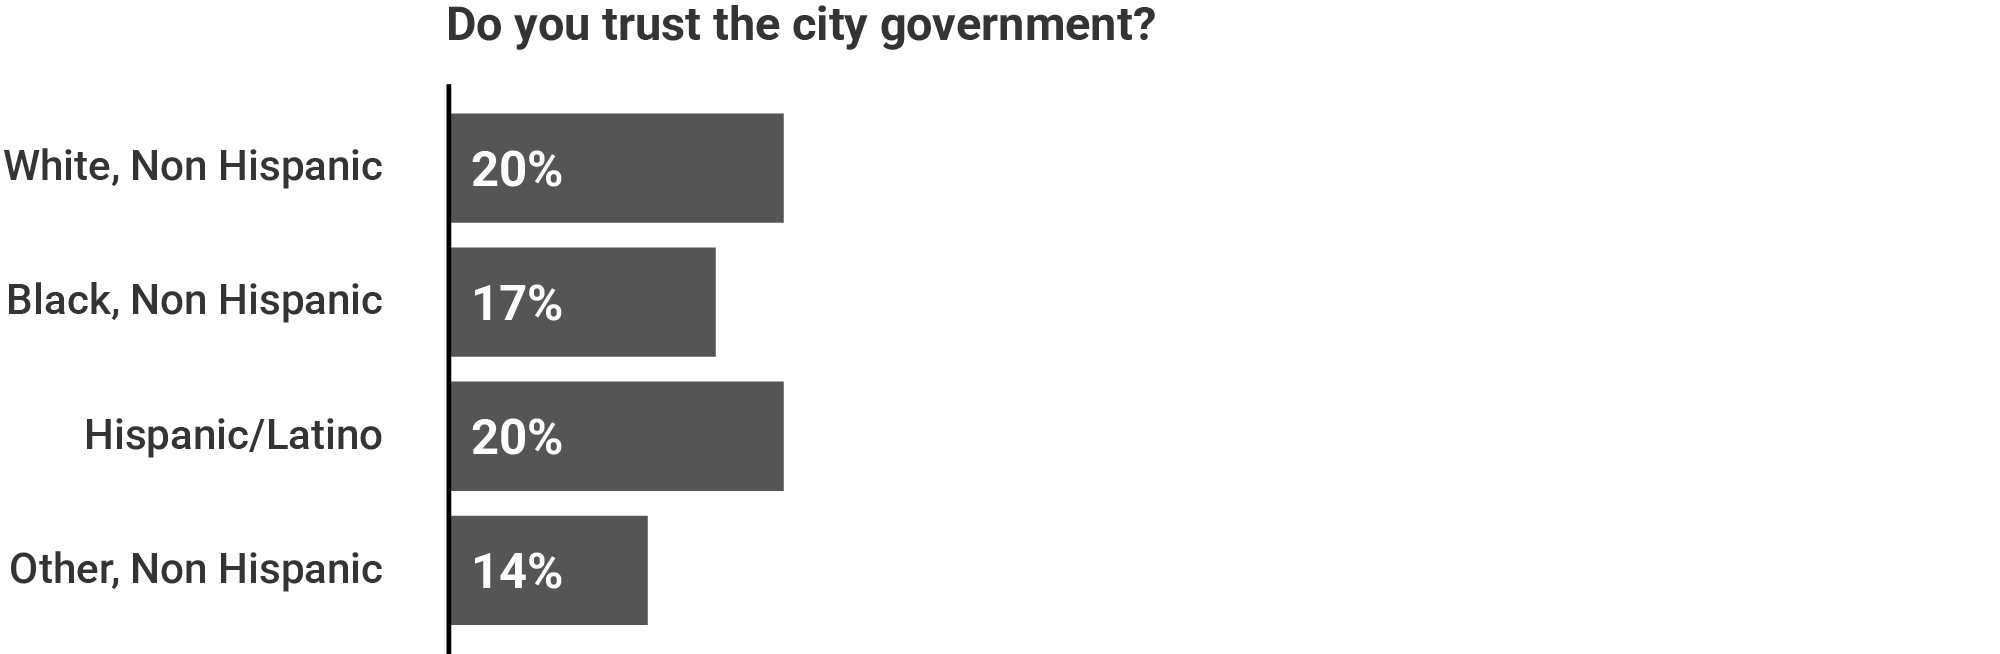
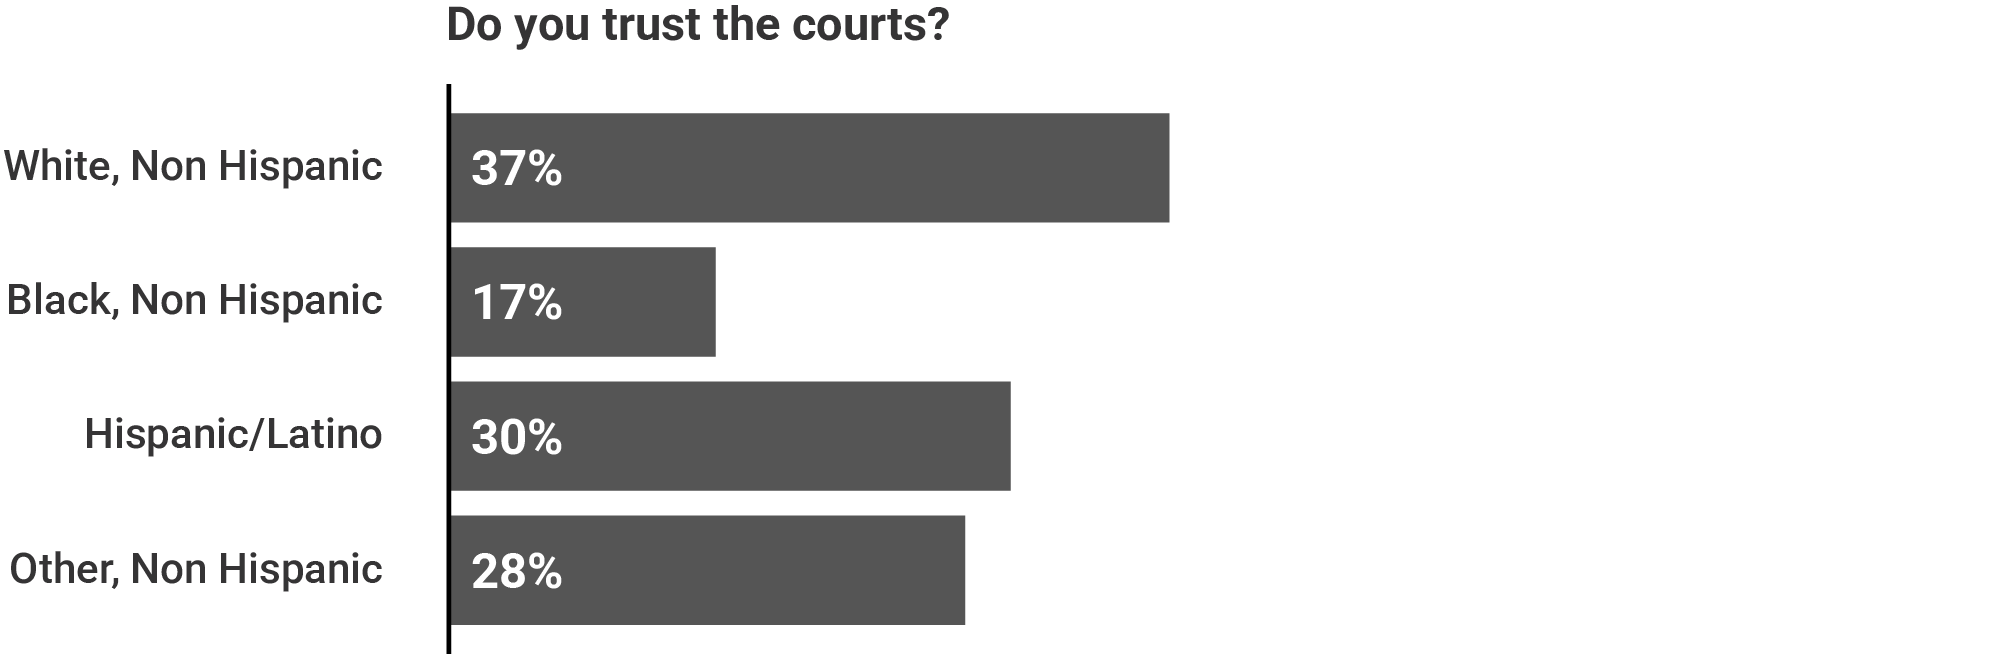
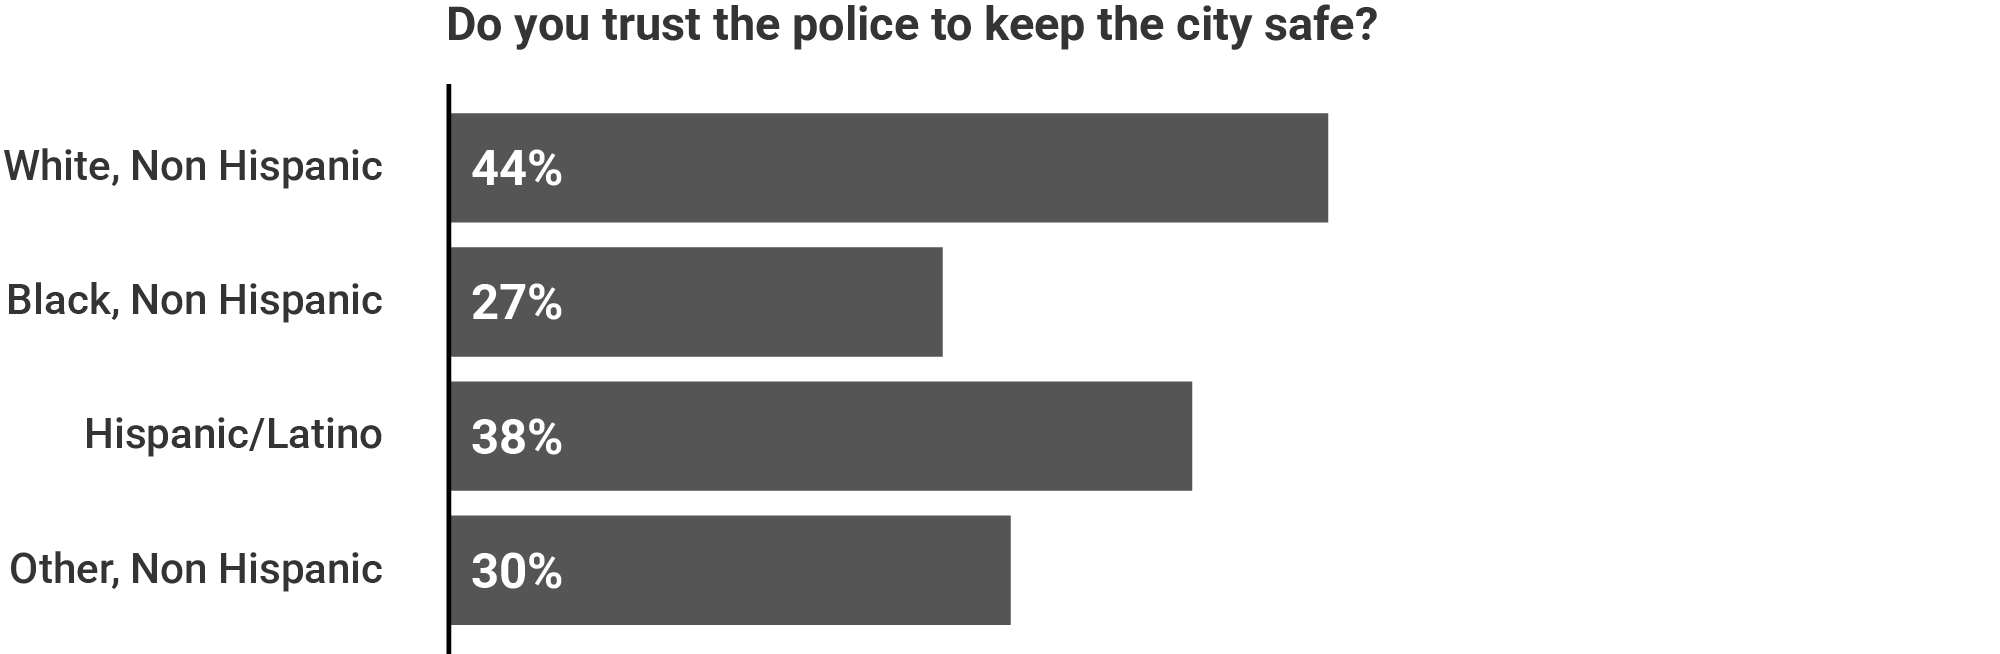
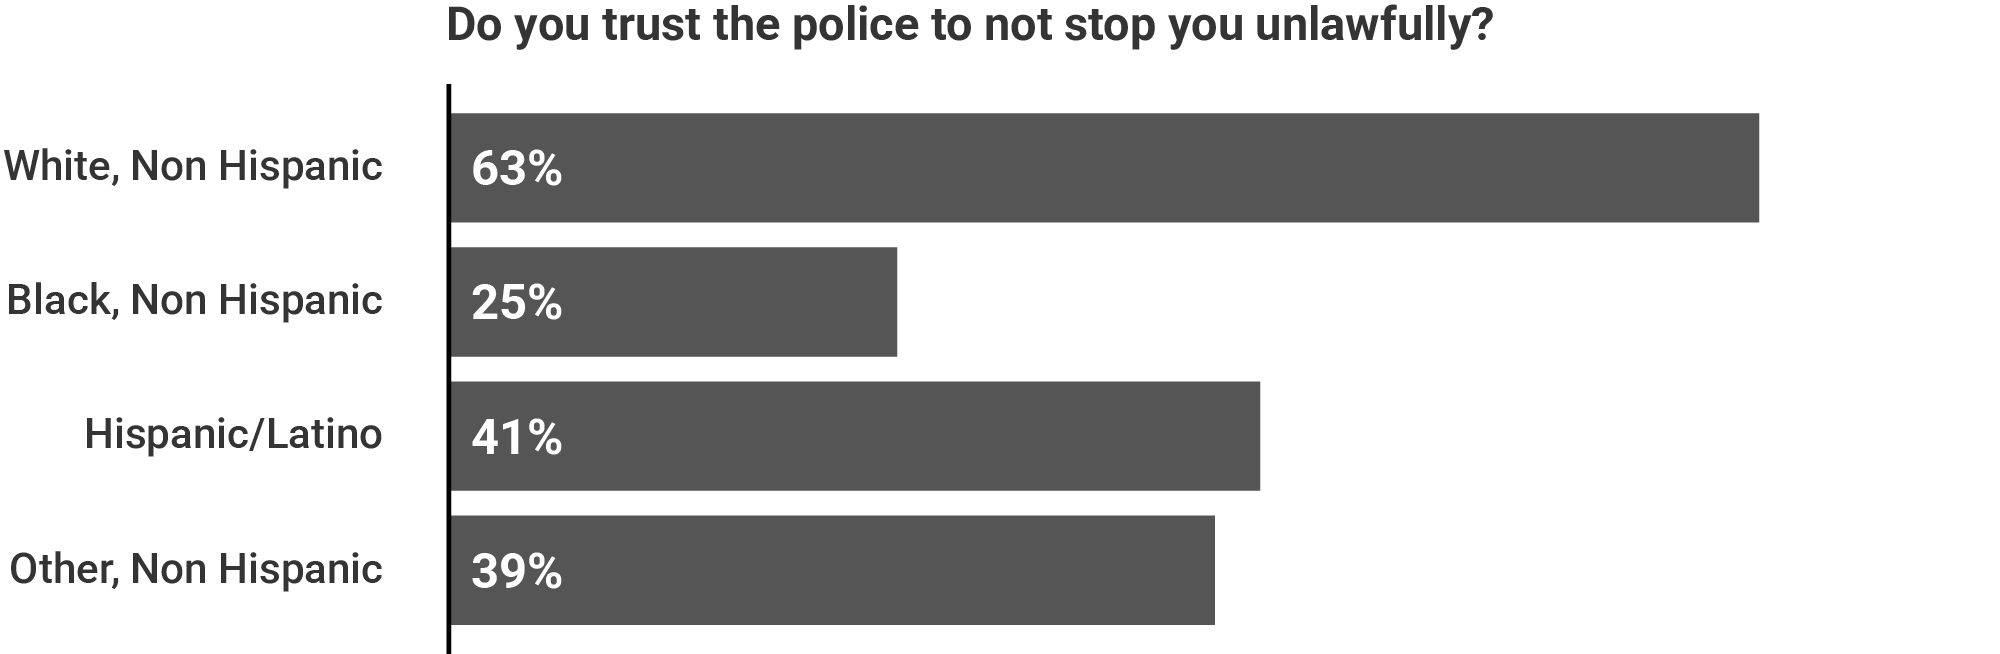
Trust in Police, Courts & Government
Less than half of residents trust the police, courts, and city government to help when needed, to keep the city safe, or to follow the law.
- 49 percent of residents trust the police to be helpful when they call for service.
- 44 percent of residents trust the police not to stop them unlawfully.
- 36 percent of residents trust the police to keep the city safe, which ranks better than trust in the courts (28 percent) and trust in city government overall (19 percent).
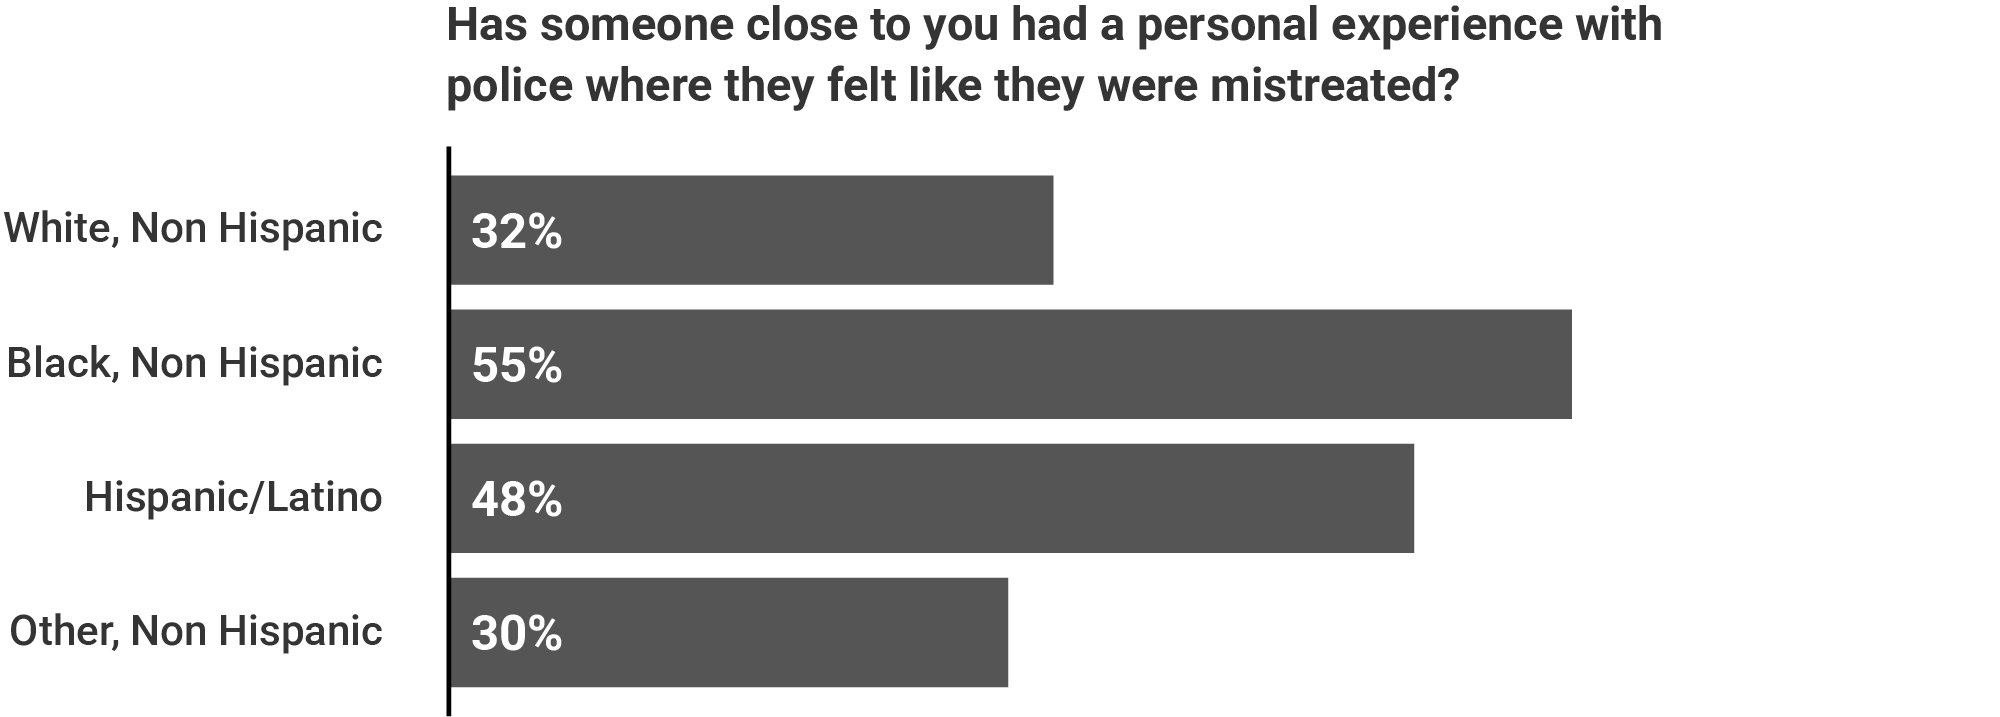
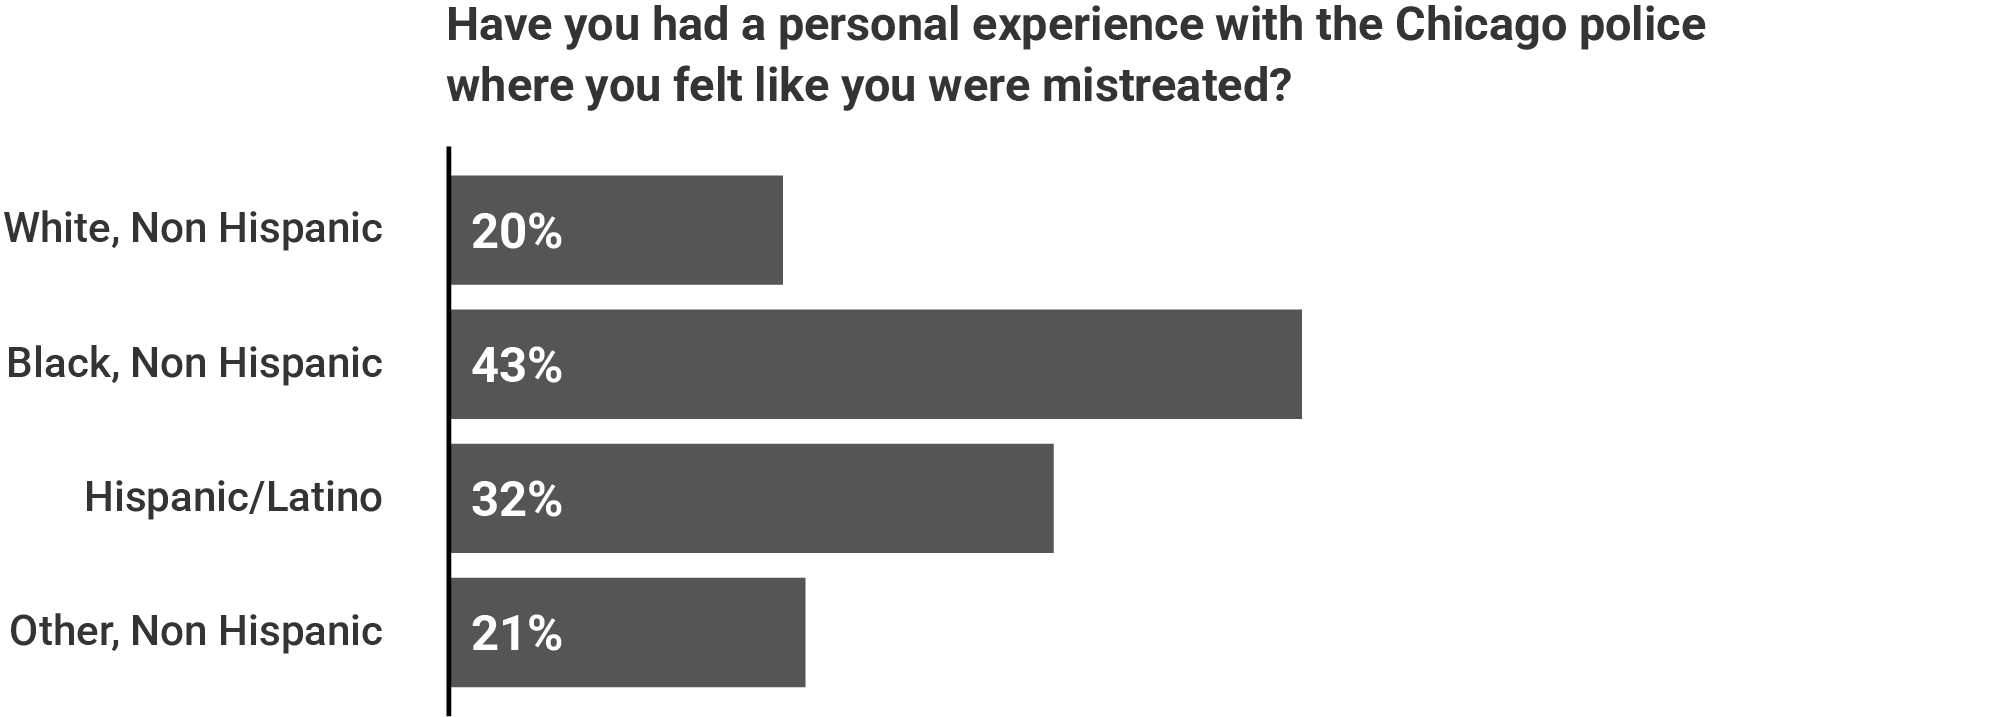
Some responses differ by race and age.
- 38 percent of 18- to 29-year-old residents trust the police to be helpful when they call, compared to 57 percent of residents aged 60 and older.
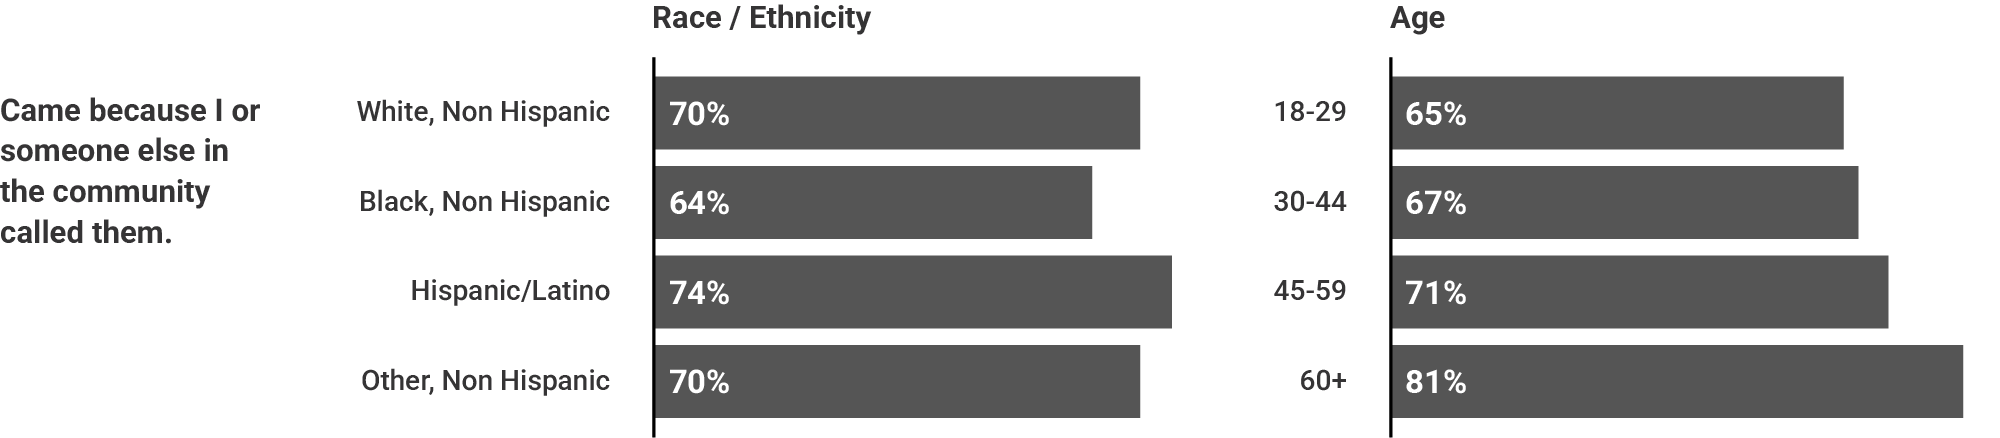
- Residents age 18-29 (55 percent) and age 30-44 (69 percent) were significantly less likely to call the police if something looked dangerous in their neighborhood compared to residents 60 and older (84 percent).
- 25 percent of Black residents trust the police not to stop them unlawfully compared to 63 percent of White residents.
- 17 percent of Black residents trust the courts, compared to 37 percent of White residents.
- 43 percent of Black residents have had an experience where they felt mistreated by police, compared to 20 percent of White residents.
- 55 percent of Black residents have someone close to them who has had an experience of feeling mistreated by police, compared to 32 percent of White residents.
Fairness in Policing
Chicagoans’ feelings about fairness in policing were ambivalent and varied based on the circumstances.
The survey asked 10 questions about procedural justice in policing, which is a measure of whether people thought they were treated fairly in their interactions with police officers. Across all 10 of the measures, between 50 and 69 percent of all residents thought they were treated fairly. People were especially likely to agree or strongly agree that, based on their last interaction, the police were responding to real problems. Residents reported less agreement that police were sincerely trying to help them or consider their opinion when making a decision.
Percent of residents who agree or strongly agree that in their most recent interaction with a police officer, the officer…


Methodology
Study Target Population: Chicagoans Age 18+
Overall Sample Size: 1,084
Survey Field Period: March 20, 2025-April 7, 2025
NORC conducted this survey using the ChicagoSpeaks™ Q1 2025 Omnibus Survey using two sample sources: (1) NORC’s ChicagoSpeaks™ Panelists, and (2) Chicago residents from Dynata’s web panel. ChicagoSpeaks™ is a probability-based panel of Chicago residents and Dynata is a non-probability panel. The final survey estimates were calibrated to account for these different sample sources. This research was done to support a scientifically rigorous, community-driven research resource for informing policymakers and the public with accurate information about the experiences and opinions of all Chicago residents. The survey was offered in English and Spanish and was self-administered by the respondent online via the Web. The overall margin of sampling error is +/- 4.4 percentage points at the 95 percent confidence level, including the design effect. Sampling error is only one of many potential sources of error and there may be other unmeasured error in this or any other survey.
Quality assurance checks were conducted to ensure data quality. In total, 18 interviews were removed for nonresponse to at least 50 percent of the questions asked of them or for completing the survey in less than one-third the median interview time for the full sample. These interviews were excluded from the data file prior to weighting.
Final data was weighted using NORC’s TrueNorth Calibration methodology. First, a weighted tree model is fit to the combined probability and nonprobability sample. Second, based on the fitted tree model, NORC estimates the probabilities of inclusion in the combined probability and nonprobability sample and computes the initial weights as the inverse of the estimated probabilities. Third, poststratification adjustments, including calibration to benchmarks and weight trimming, are made to the initial weights to create the final weights.
Poststratification variables included Chicago region, age, gender, race/ethnicity, and educational attainment. The sociodemographic characteristics are weighted to benchmarks from the American Community Survey 2023 1-year estimates. All data in the survey, including race/ethnicity, are self-reported.
For questions about data and methodology, please email chipublicsafety@norc.org.