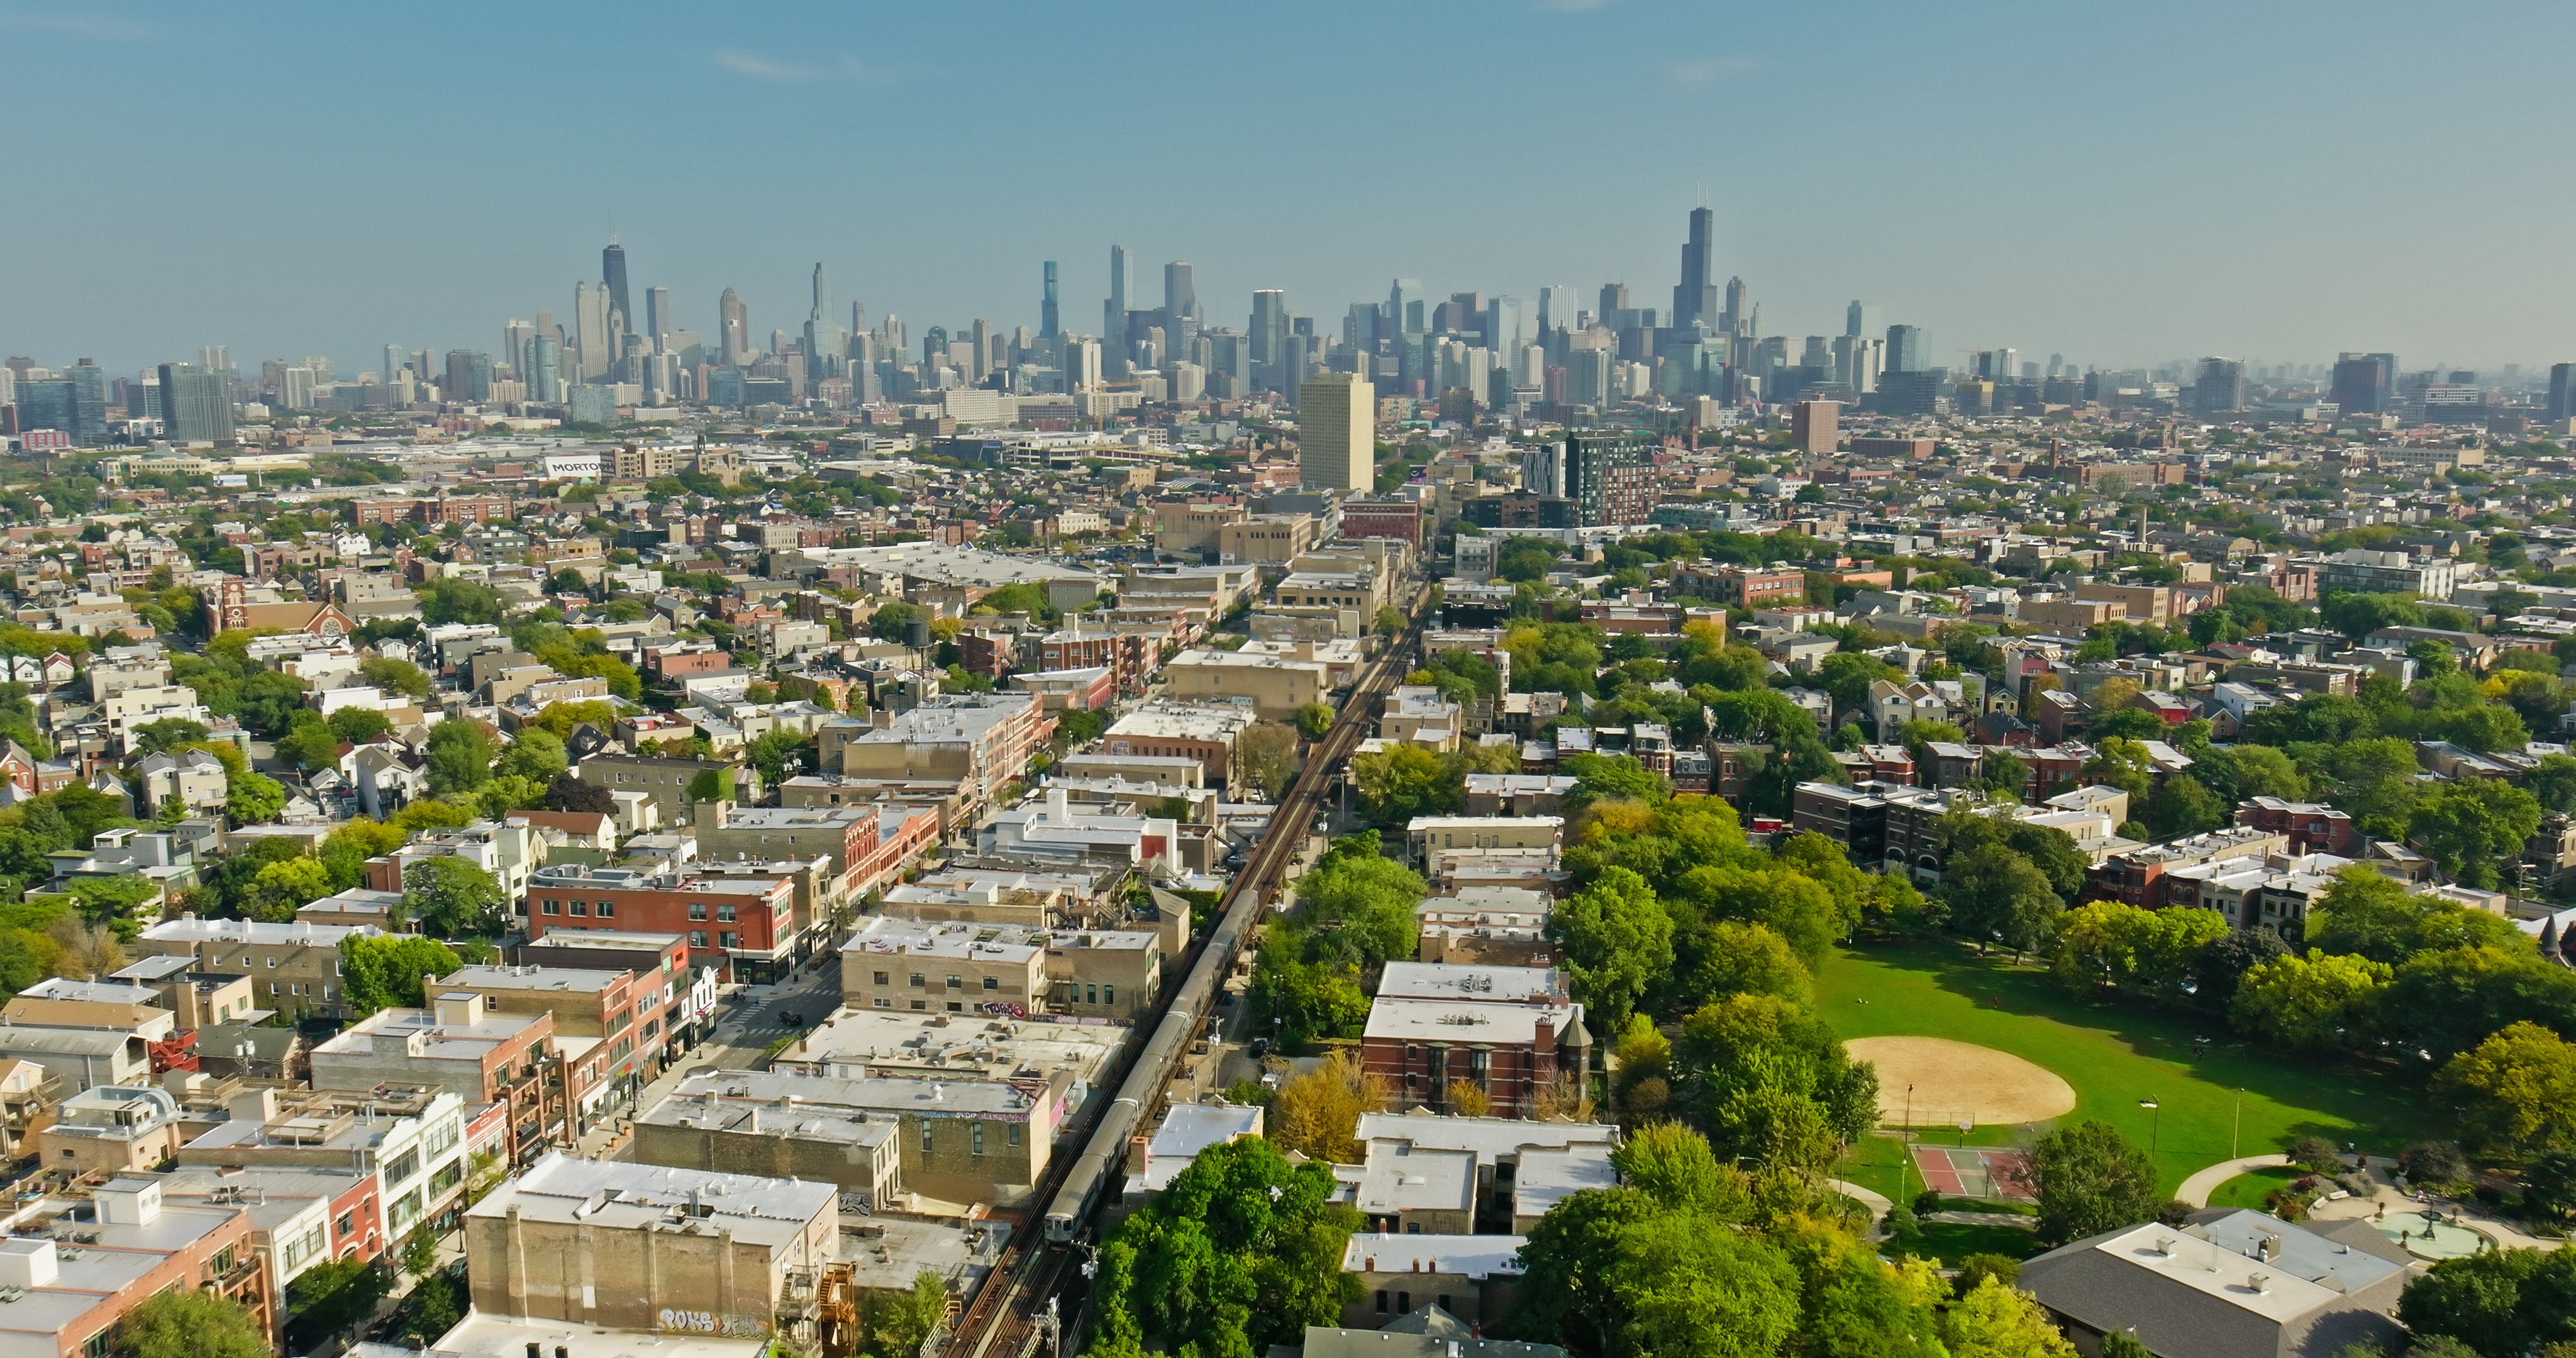
Identifying Local Needs & Local Solutions
People’s experiences and perceptions of Chicago depend on where they live and work. We want to make Chicago safer for everyone in all parts of the city.
By mapping the distribution of violent crimes and demographic data and identifying trends across Chicago’s Community Areas, we can track our success and inform future public safety strategies.
Methodology
Definitions
- Shootings: Number of fatal and non-fatal shooting victims.
- Homicides: Number of incidents. Includes murder, negligent, and non-negligent manslaughter. Justifiable homicide is not included.
- Violent Crime Incidents: Number of incidents. Includes robbery, rape/criminal sexual assault, aggravated assault/battery, and homicide.
Sources
- Chicago Police Department through the Chicago Data Portal API
- Chicago Community Data Snapshots based on data from the U.S. Census Bureau 2019-2023 American Community Survey
Limitations
The data presented here comprise the best available information published by the relevant public agencies. Like all large datasets, they are imperfect. Crime classifications are provided by the reporting agencies and may change later based on additional investigation. Many agencies do not guarantee the accuracy, completeness, timeliness, or correct sequencing of their information.
Additional Notes
- Offense definitions come from the National Incident-Based Reporting System (NIBRS) and are based on common-law definitions.
- Crime data are updated monthly.

