
What 311 Requests Add to the Public Safety Picture
Updates & Insights
View the latest changes to the DataHub and read commentary and analysis from our community of experts and contributors.
November 2026
Every year, thousands of Chicago residents contact the City to report a building on their block that appears to be vacant or abandoned.
Each report reflects a local issue not directly captured in crime data. Crime data show where incidents were reported, but not the condition of the blocks around them.
The Chicago Public Safety DataHub now includes 311 service request data alongside crime data. A 311 service request is a non-emergency request to the city, such as reporting a streetlight outage or a building that appears vacant. This post shows how to explore this data and why they matter in understanding crime contexts.
Why Add 311 Data to a Public Safety Tool?
Public safety is shaped by more than crime incidents. An unsecured vacant building can be entered without permission, used to store or hide contraband, or become a fire and safety risk for nearby homes. Adding 311 indicators to the DataHub lets users see where crime patterns overlap with visible neighborhood conditions.
That overlap needs to be interpreted with care. A vacant building complaint doesn’t mean the building is causing crime on the block, and a block with many 311 complaints isn’t necessarily a block with more crime.
For city agencies, complaint data can show where vacant buildings draw repeated attention from residents and where those locations overlap with public safety concerns, which can support coordination across departments. Community organizations can use the same view to see where neighborhood conditions and public safety challenges meet and where programs or services may be most needed. Residents can check whether neighbors share a concern they’ve raised about a building on their block.
How to Explore City Service Requests
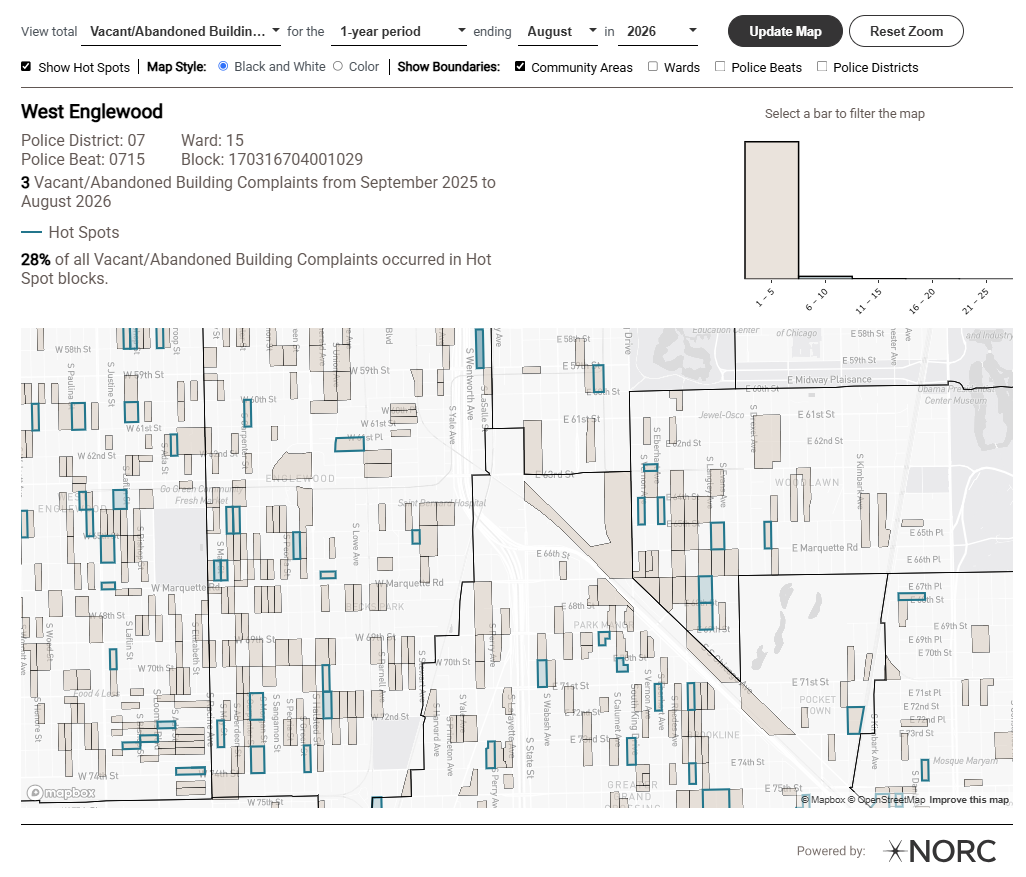
To see where complaints are concentrated at the block level, go to the Crime and City Services, Block by Block map. Select an indicator and time period, then select Update Map. Toggling on the “Show Hot Spots” checkbox highlights the blocks with the highest concentrations. Hot Spots for 311 data are defined the same way as they are for crime indicators. For example, graffiti removal request Hot Spots are the 5 percent of blocks citywide that saw the highest frequency of graffiti removal requests during the period. Building violation complaint Hot Spots are the 5 percent of blocks citywide that saw the highest frequency of building violation complaints during the period. As with the crime indicators, blocks must have at least two complaints during the period to count as a hot spot.
For this post, we’ve selected Vacant/Abandoned Building Complaints for the one-year period ending August 2026, with Hot Spots turned on. The underlying data are updated frequently, so the same selections made today may produce different counts than those shown in this post’s visuals.
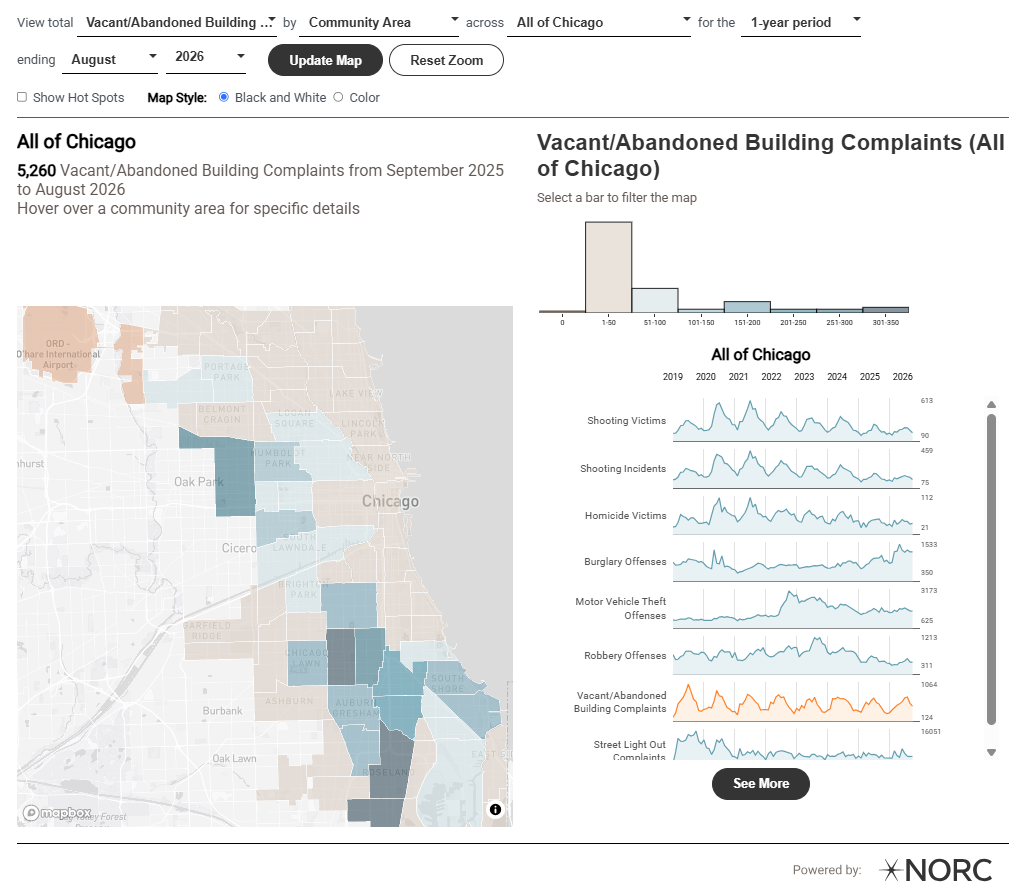
To see how complaints have changed over time, go to the Explore Trends Over Time page. Select Vacant/Abandoned Building Complaints, then Community Area, All of Chicago, and the same time period, and select Update Map. The map shows complaints by Community Area, and the sparklines beside it which show the trend in monthly counts back to 2019 for this and other indicators, such as Shooting Victims and Burglary Offenses.
What the Data Show
Chicago residents made 5,260 Vacant/Abandoned Building Complaints between September 2025 and August 2026. The highest count in this time period was in West Englewood, with 328 complaints.
The sparklines show that complaints rise in the warmer months and fall in the colder ones, and that they appear to have declined overall in recent years. Residents made 1,062 complaints in July 2019, compared with 671 in July 2026.
What a Complaint Measures
Each complaint represents a 311 request made to the City of Chicago. It measures what residents reported, not every vacant building in the city.
One building can generate several complaints if more than one neighbor calls or the same person calls again. A building that has been empty for years may generate none if neighbors never reported it or stopped expecting a response. Reporting habits also differ from one community to the next, so a higher count may reflect more vacant buildings, more active reporting, or both.
Bottom Line
Vacant and abandoned buildings are part of how residents experience safety on their block. Adding 311 complaints to the DataHub puts those conditions on the same map as crime data, down to the block level. The complaints don’t explain why crime occurs where it does, but they do show where residents are asking the city for help and where those requests overlap with public safety concerns and deserve a closer look.