
Using Hot Spots to See Where Homicides Are Most Concentrated
Updates & Insights
View the latest changes to the DataHub and read commentary and analysis from our community of experts and contributors.
November 2026
Chicago recorded 443 homicides between September 2025 and August 2026.
While this total is down substantially from the post-pandemic peak, 443 homicides are still too many. Looking at where homicides are concentrated can help community leaders and public safety agencies identify places that warrant closer attention to help deter future homicides.
The Chicago Public Safety DataHub’s new mapping tools are designed to help identify Hot Spots. Our Hot Spots option highlights census blocks with the highest concentrations of incidents during the selected period. Community organizations, service providers, researchers, journalists, public safety agencies, and other local leaders can use this information as one factor when deciding where to focus their efforts. Using homicides as an example, this post explains how to use and interpret this feature.
How to Display Hot Spots
To get started, go to the Crime and City Services, Block by Block map. Select an indicator of interest for the time period of your choice, then select Update Map. Toggle on the Show Hot Spots checkbox, choose a map style, and select any boundaries you’d like to view. For this analysis, we’ve selected Homicide Victims for the one-year period ending August 2026. The underlying data are updated frequently, so the same selections made today may produce different counts than those shown in this post’s visuals.
Once toggled on, Hot Spot blocks are highlighted with a blue outline. Blocks are the smallest geography defined by the Census Bureau. They are defined by visible features such as streets, railroad tracks, and streams. Hot Spot blocks are determined by the indicator and time period selected.
What the Hot Spots Represent
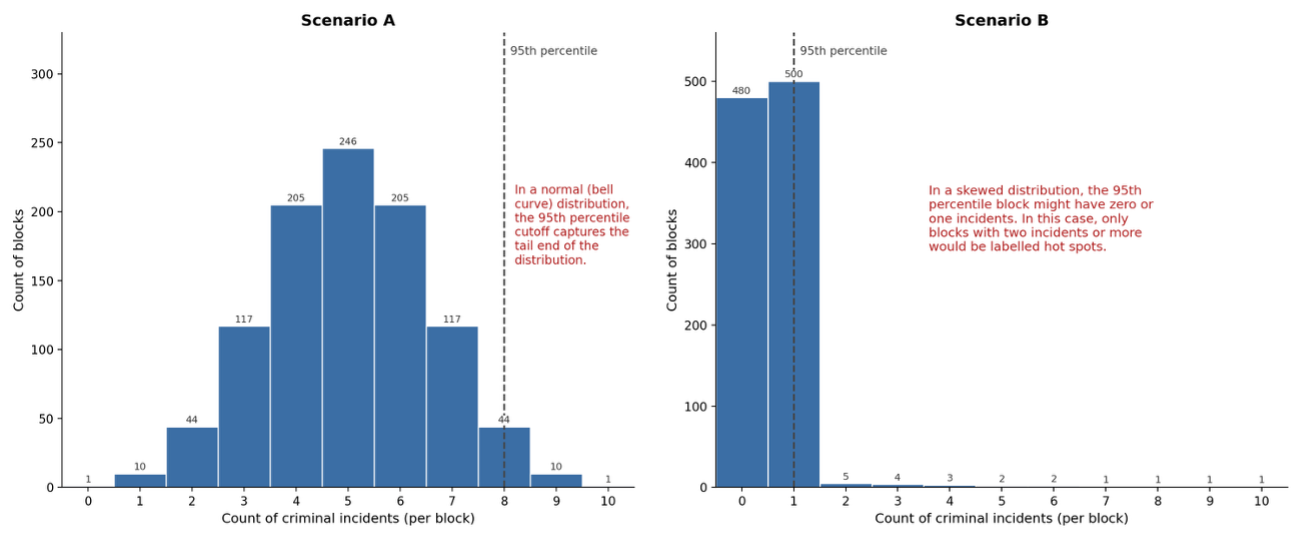
To identify Hot Spots, the Chicago Public Safety DataHub totals the incidents for the indicator of interest in each of Chicago’s 39,479 census blocks over the selected period and compares the results citywide. A block is labeled as a Hot Spot only if it meets two tests. First, the count must be in the top 5 percent of all blocks citywide (the 95th percentile), with blocks tied at that cutoff included. Second, the block must have had at least two incidents during the period.
The second test matters for homicide and other crimes that happen less frequently. When most blocks have zero homicides, the 95th-percentile cutoff ends up being zero. The same logic applies to blocks where a single incident would be labeled as a Hot Spot using just a 95th-percentile cutoff. We avoid these issues by requiring a minimum of two incidents to qualify as a Hot Spot. This is described in Scenario B in the graphic below, and in this instance, the Hot Spot indicator provides little useful information. By contrast, Scenario A, describes variation in the count of criminal incidents and the identification of Hot Spots at the 95th percentile contributes additional information.
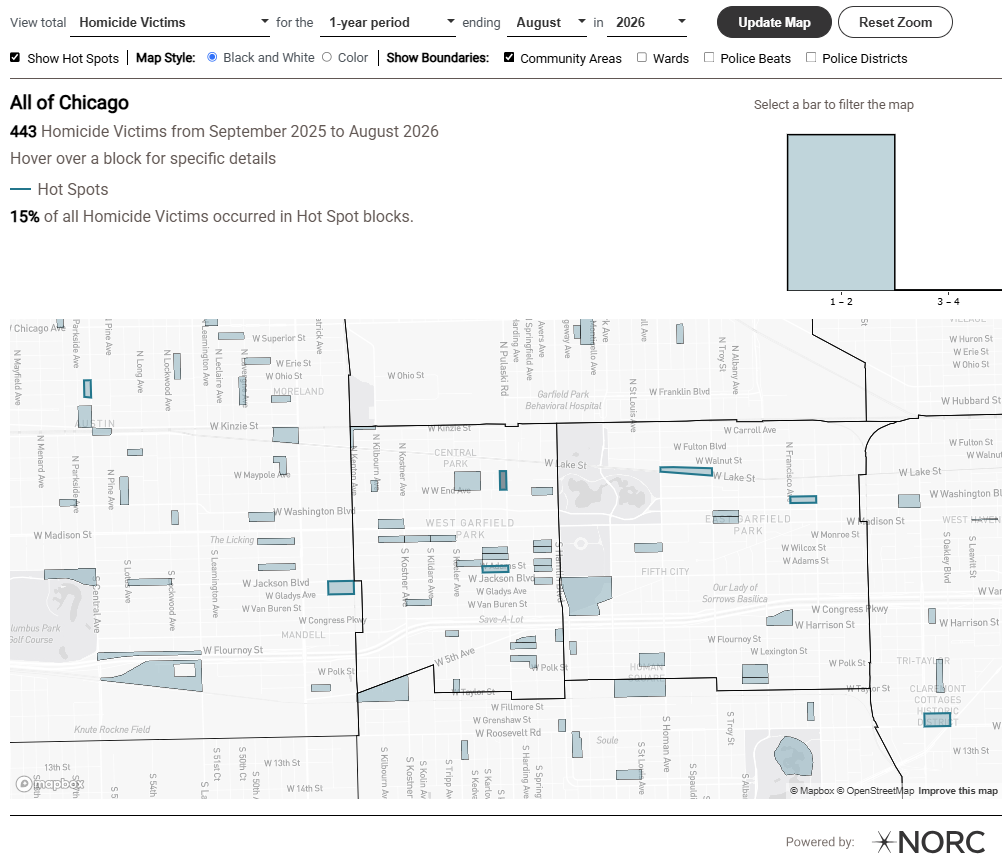
The map below shows Hot Spots for homicide victims as an example. During the time period selected, there were 443 homicides, which occurred on 408 blocks, or about 1 percent of all blocks citywide. Most blocks (377) had only one homicide, 28 had two, 2 had three, and 1 had four. With the two-incident minimum applied, 31 blocks are identified as homicide Hot Spots, and these are shown with a solid blue boundary. The small number of highlighted blocks reflects how rare multiple homicides are at the block level. Since 2019, only three Chicago blocks have experienced five homicides in a single calendar year, and no block has experienced more than five homicides.
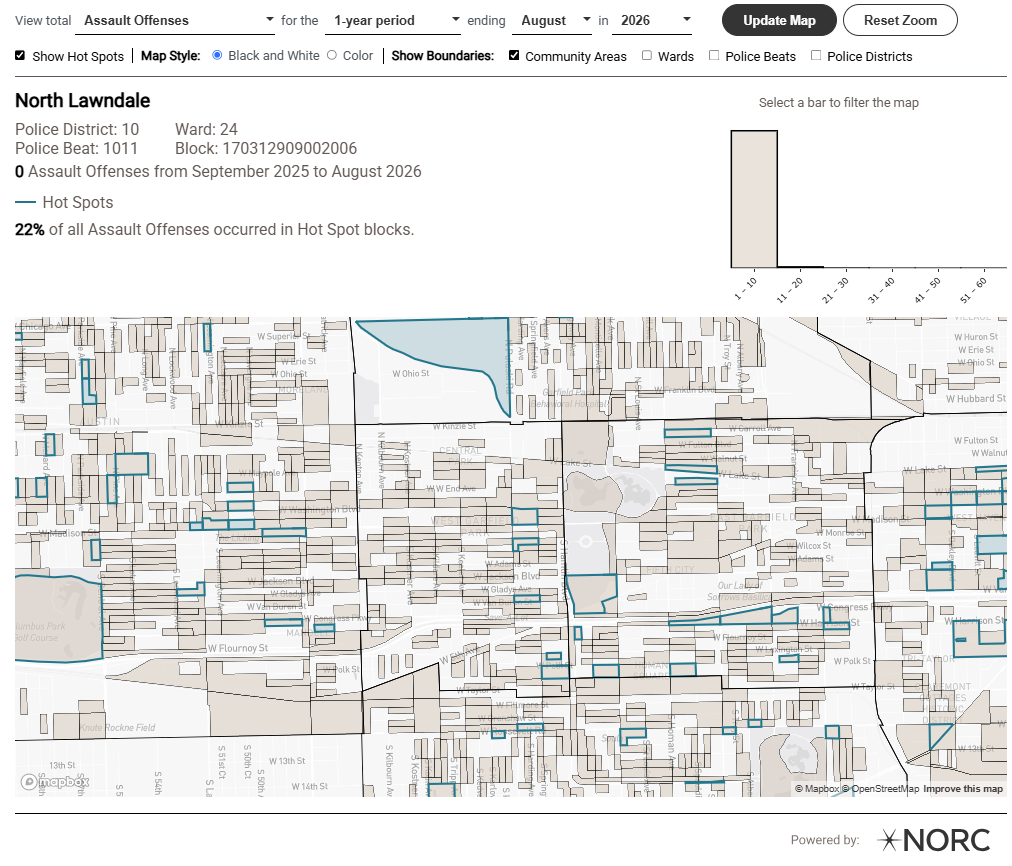
The value of Hot Spots analysis is improved for crimes that are more common, and assault offenses provide a useful comparison. A total of 10,291 blocks recorded at least one assault during the one-year period presented on the map below. Of those, 10,180 had between 1 and 10 assaults. Another 99 blocks had 11 to 20 assaults, while 12 blocks had more than 20. In this case, any block with six or more assaults is classified as a Hot Spot block for assaults.
How Hot Spots Can Be Used
The standard map shows where crime occurred. The Hot Spots view adds an additional piece of information by highlighting blocks that had the highest concentrations compared with other blocks citywide.
Hot Spot designations are relative. They identify blocks that meet both the citywide concentration threshold and the two-incident minimum. It does not mean that every highlighted block had the same number of incidents or faces the same conditions. For homicide and other less frequent crimes, few blocks qualify, and the difference between them may be only one or two incidents.
Using the Hot Spots indicator in combination with the DataHub’s time selection feature, creates a visual description of blocks that highlight persistent crime problems. A normally safe block that experiences a mass shooting event will show up as a shootings Hot Spot for this year but not for prior years. On the other hand, a Hot Spot this year that was also a Hot Spot each of the past three years represents a chronic crime problem.
Block-level patterns are best considered alongside local knowledge about the area. Nearby land uses and patterns of routine activity also provide useful context. A highlighted block does not solely characterize the people who live there or the surrounding neighborhood. It identifies a specific place and period that may merit a closer look.
Bottom Line
The Hot Spots option makes it easier to distinguish between places where an incident occurred once and blocks where incidents were concentrated during the selected period. In the homicide example, only 31 of Chicago’s 39,479 census blocks met the Hot Spot definition, yet those blocks accounted for 15 percent of all homicides. That does not explain why the concentration occurred or prescribe a particular response. It does give community leaders a more focused starting point for examining local conditions, tracking whether patterns persist, and considering where deterrence efforts may be most useful.