Beyond the Unemployment Rate: Three Ways to Understand Chicago’s Labor Market
Author
Michaela McGill
Director, Hiring Initiative
Civic Committee of the Commercial Club of Chicago
April 2026
One of the Civic Committee’s core strategies for reducing Chicago’s gun violence is expanding employment opportunities across Chicago. If you haven’t visited our Tracking Progress page, that’s where we monitor labor market conditions at the Community Area level—and we’ve just added three new measures that help tell a fuller story.
Our Community Impact Map now includes new measures of employment in Chicago. The new measures include labor force participation rate, employment-population ratio, and unemployment rate. Each is calculated from the recently released 2020–2024 American Community Survey (ACS) 5-year estimates and mapped at the Community Area level. Together, they offer a detailed view of how Chicagoans engage with work across the city, and where gaps remain.
Labor Force Participation Rate
The labor force participation rate (LFPR) captures the share of the working age population that is either employed or actively looking for work. This measure distinguishes between communities where residents are not working because they cannot find jobs (high unemployment) versus communities where fewer adults are connected to the labor market at all (low labor force participation).
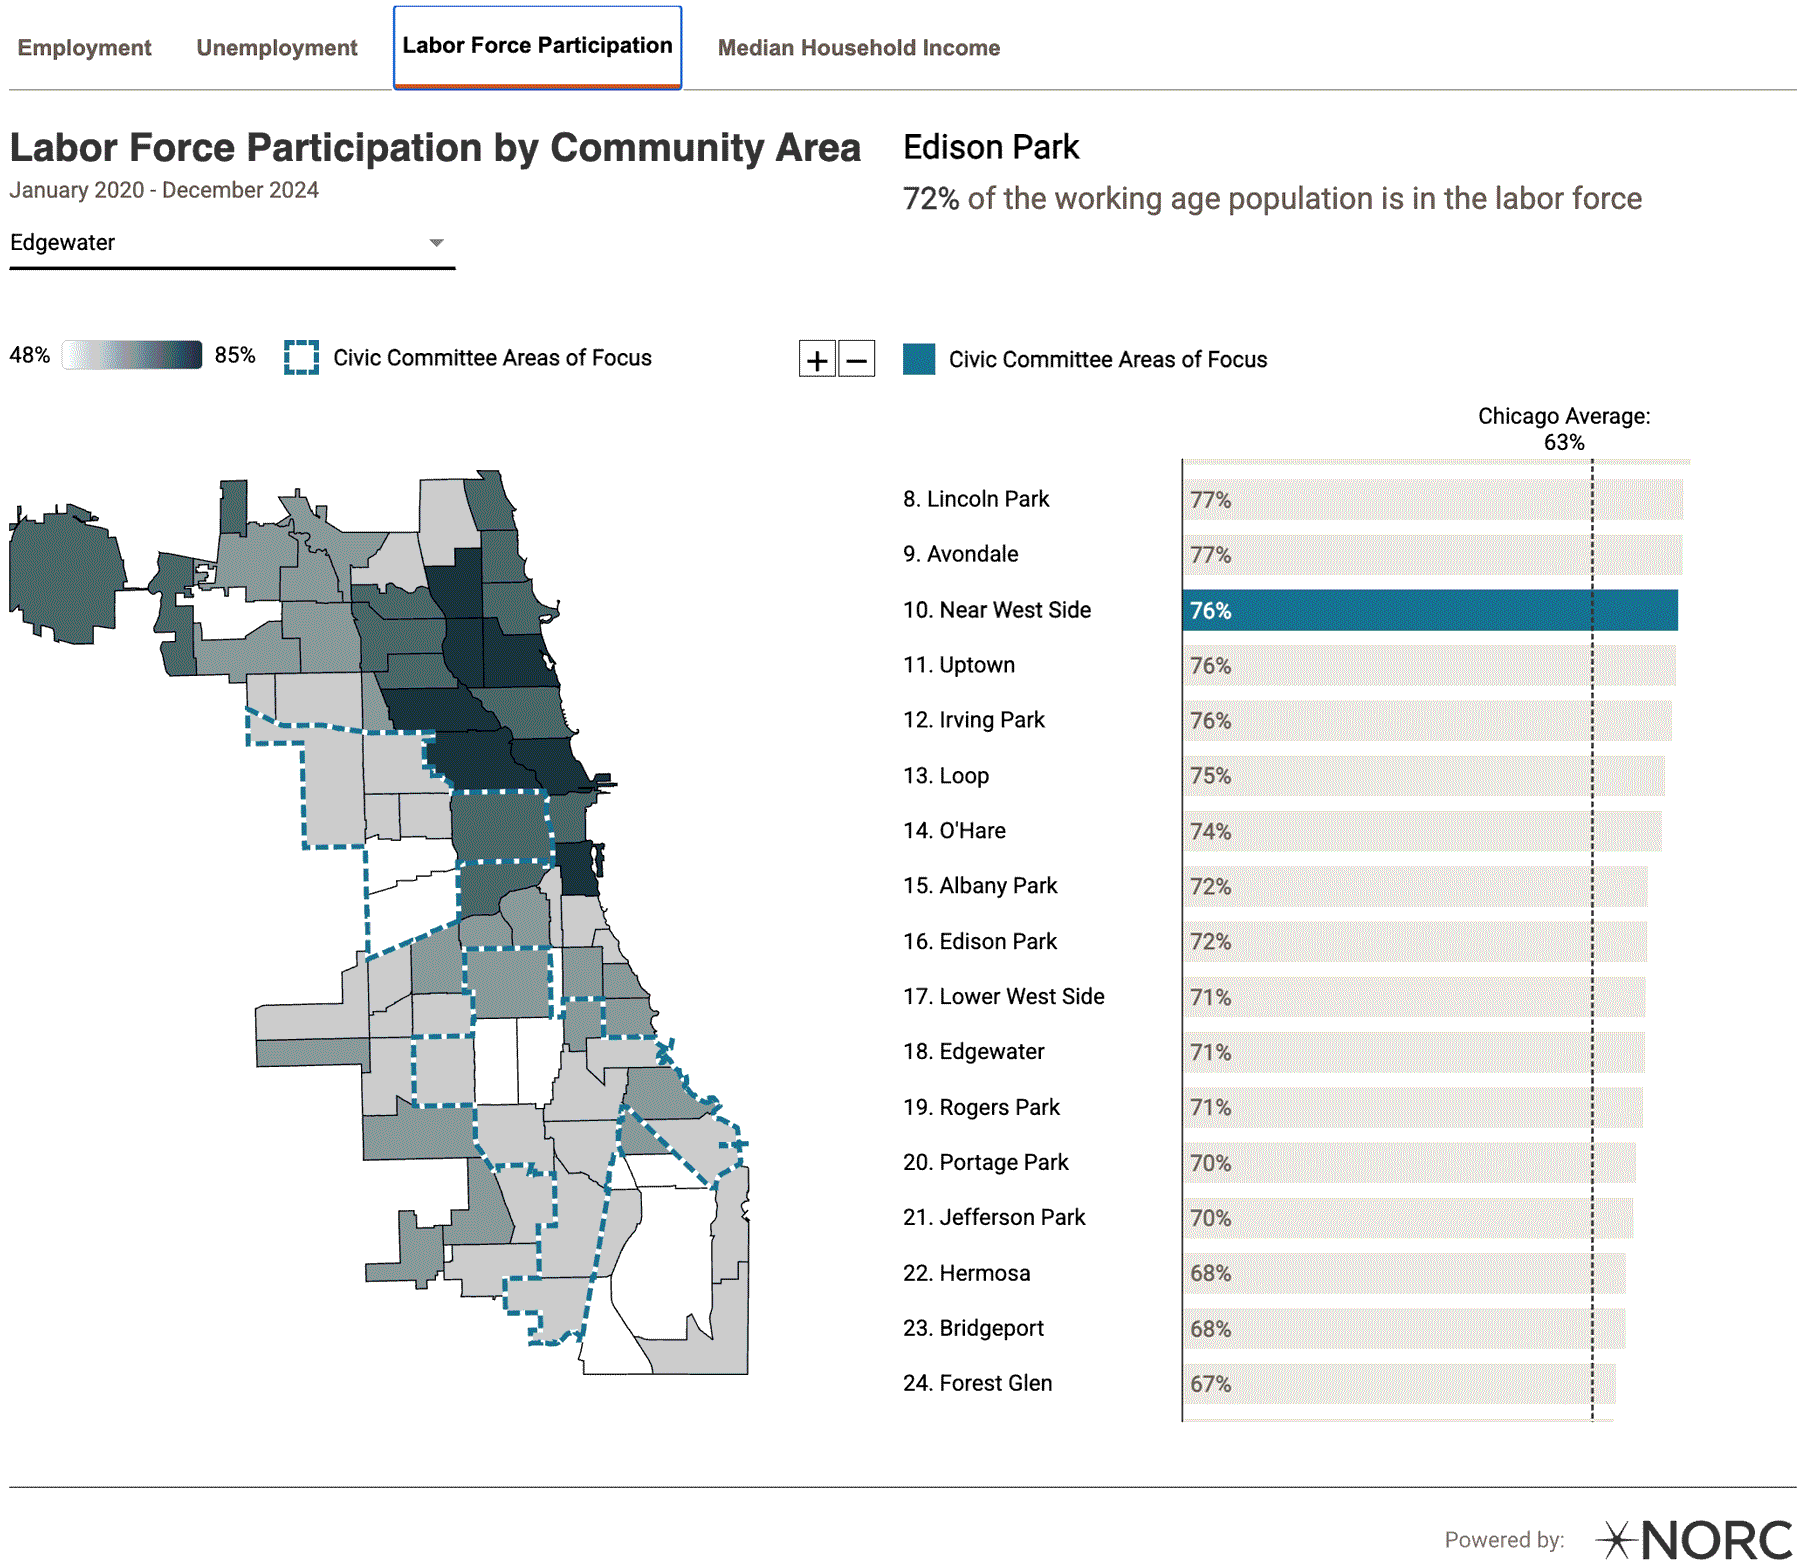
Figure 1. Screenshot of the new Labor Force Participation tab in the Community Impact Map.
When to use it: The LFPR is essential when examining long-term labor market engagement and structural barriers that may discourage work entirely. It reveals "hidden" potential workers—those who have stopped searching but might re-enter the labor market under better conditions. Early retirees and stay-at-home parents who are not looking for formal work are also outside of the labor force.
Example: If two neighborhoods have similar employment rates but different labor force participation rates, the neighborhood with lower LFPR may face deeper structural challenges (inadequate childcare, transportation barriers, disability) that keep residents from even entering the job market.
Employment-Population Ratio
The employment-population ratio measures the share of working age residents who are currently employed. Working people still count towards the employment-population ratio even if they are not working as many hours as they would like (this subgroup of employed people is considered “underemployed”). This measure captures the extent to which the working age population across Chicago’s 77 Community Areas holds jobs.
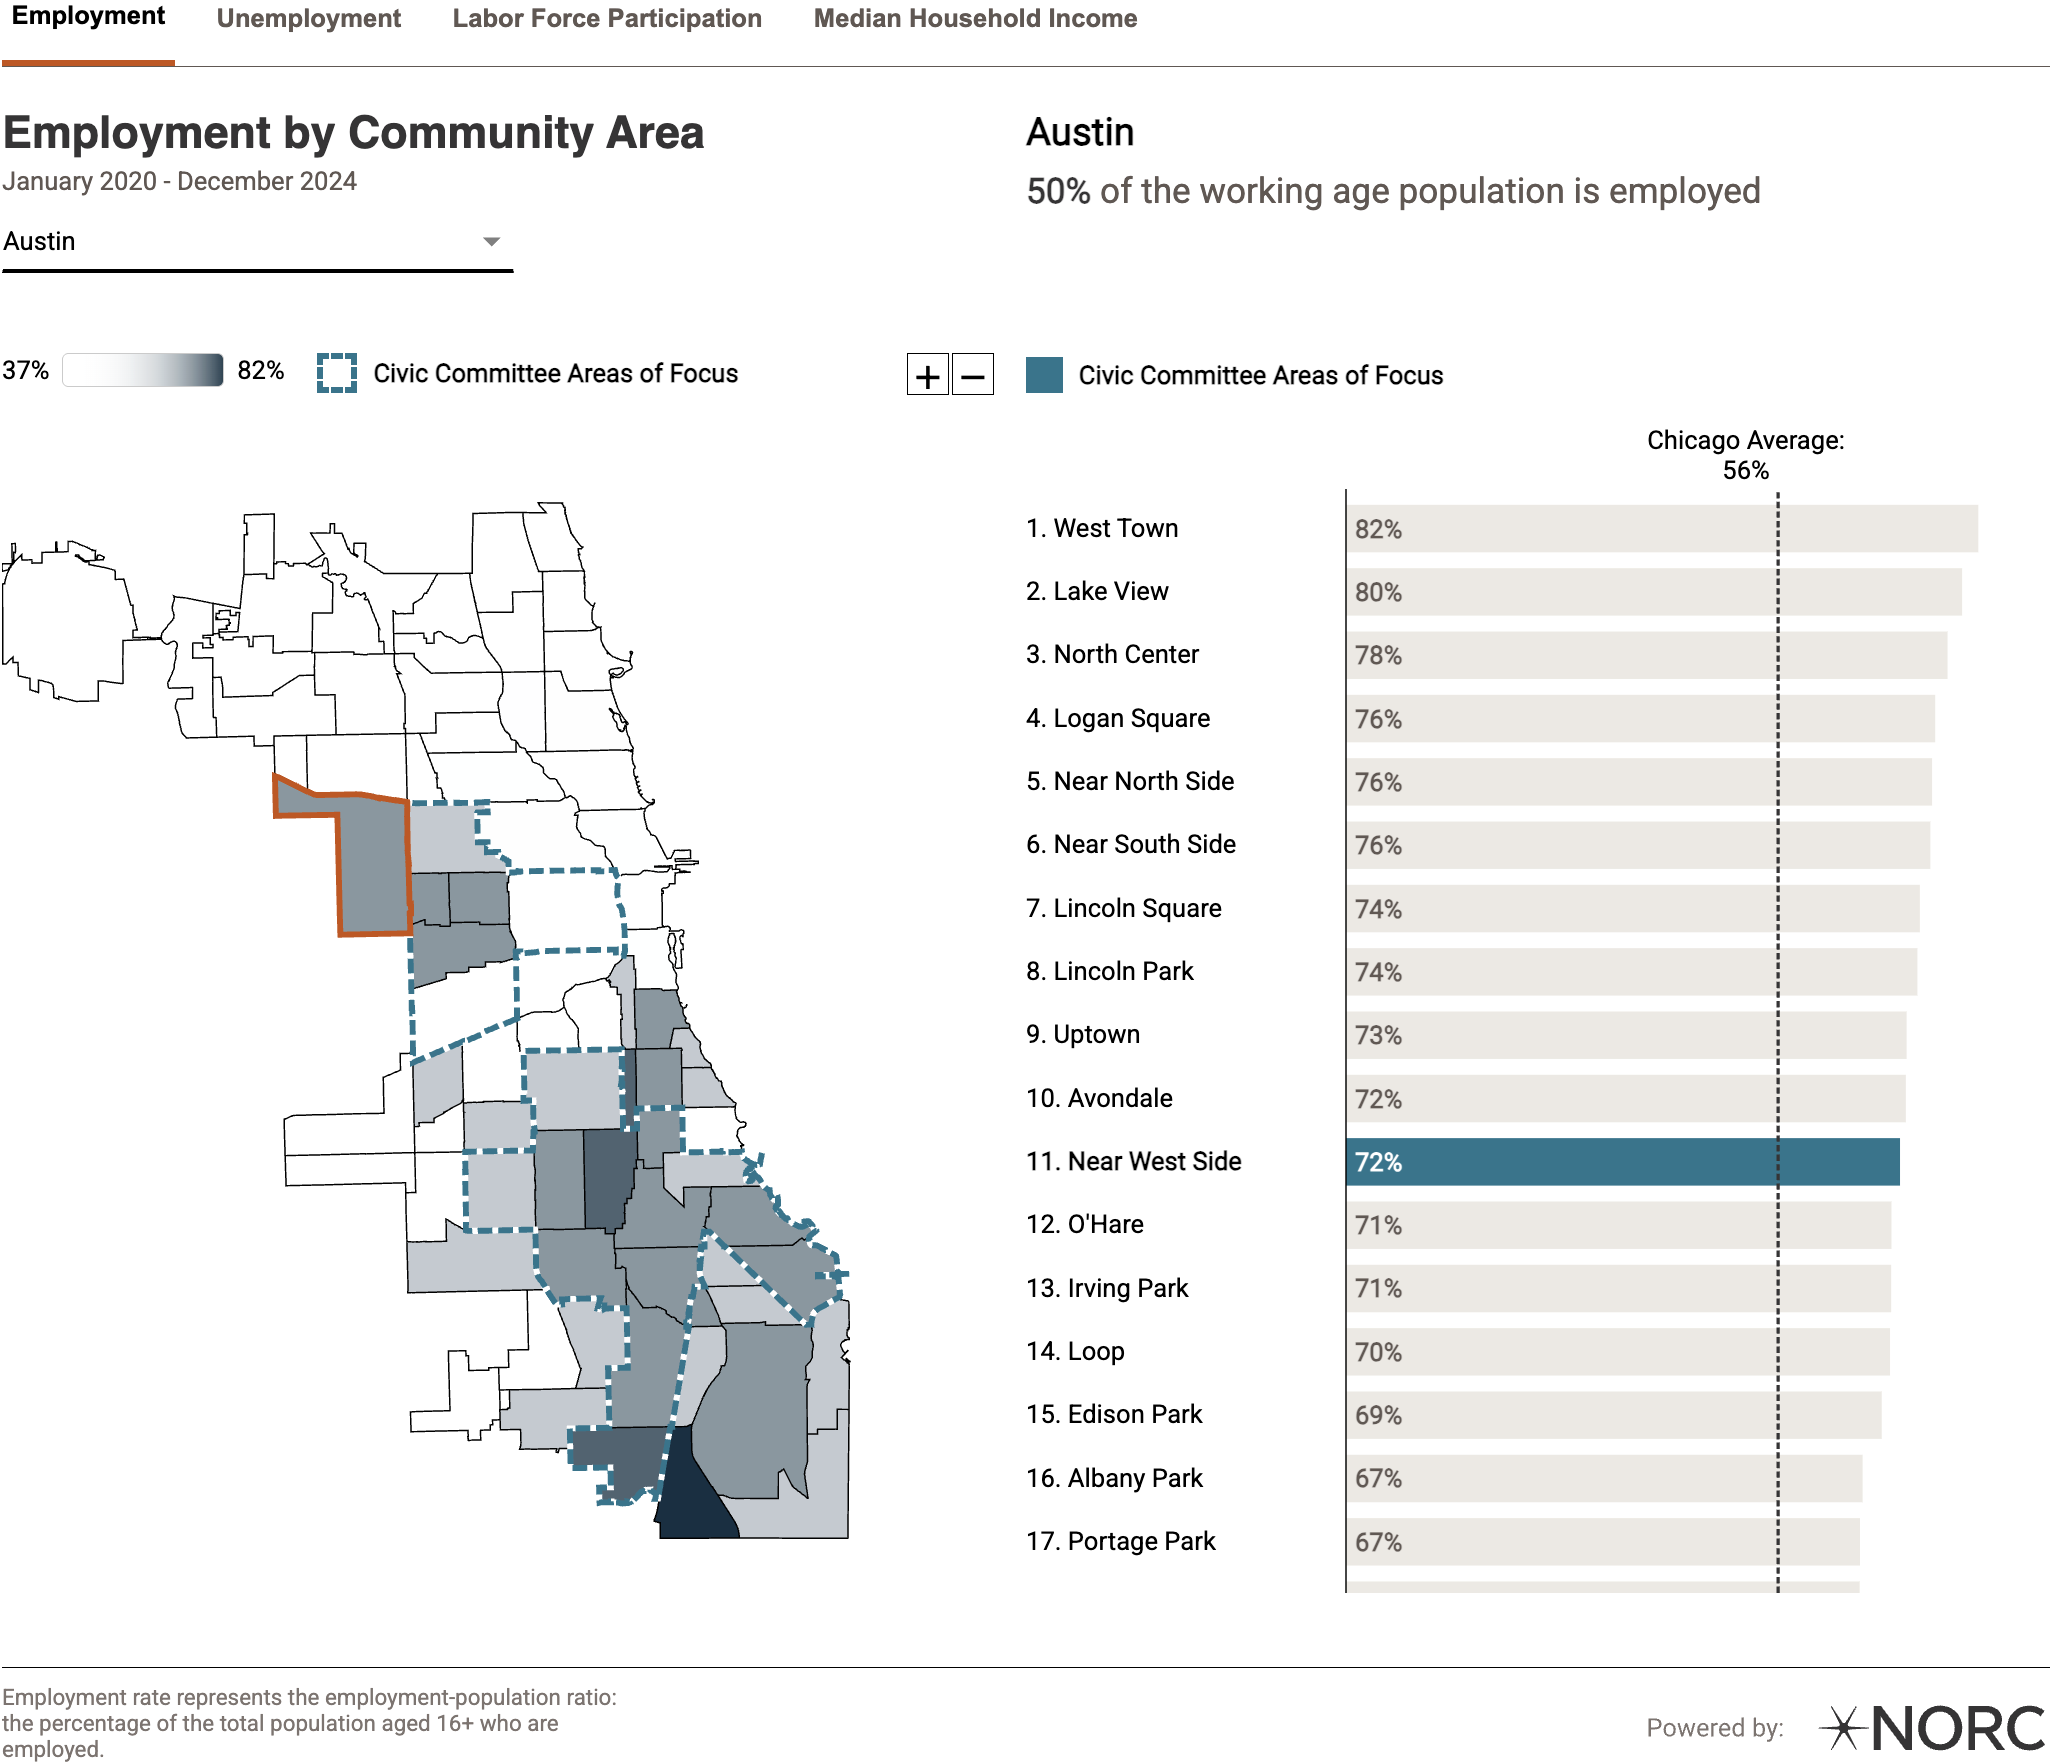
Figure 2. Screenshot of the new Employment tab with employment-population ratio data on the Community Impact Map.
When to use it: The employment-population ratio is most useful when you want to understand the overall prevalence of employment in a community, including populations that may have dropped out of active job search for various reasons. It’s particularly valuable for assessing economic well-being broadly and comparing communities with different demographic compositions (e.g., areas with many retirees or students).
Example: If you’re comparing economic outcomes across multiple neighborhoods to inform long-term investment strategies, the employment-population ratio provides a comprehensive view of how many residents are actually working.
Unemployment Rate
The unemployment rate measures the percentage of people in the labor force who are actively seeking work but unable to find it. Because it focuses exclusively on individuals participating in the labor market—those working or job hunting—it identifies communities in which jobseekers face barriers to employment. Unemployment can fluctuate throughout the year based on predictable seasonal patterns (e.g., weather, holidays, school schedules). This seasonally driven fluctuation is reflected in the data, as ACS employment data does not include seasonal adjustments. A moderate unemployment rate is a normal and healthy feature of an economy where people are entering the labor force at the end of their formal education (or after another life change) and sometimes leaving jobs to search for better opportunities. Federal policymakers target an overall unemployment rate of 4-5 percent.
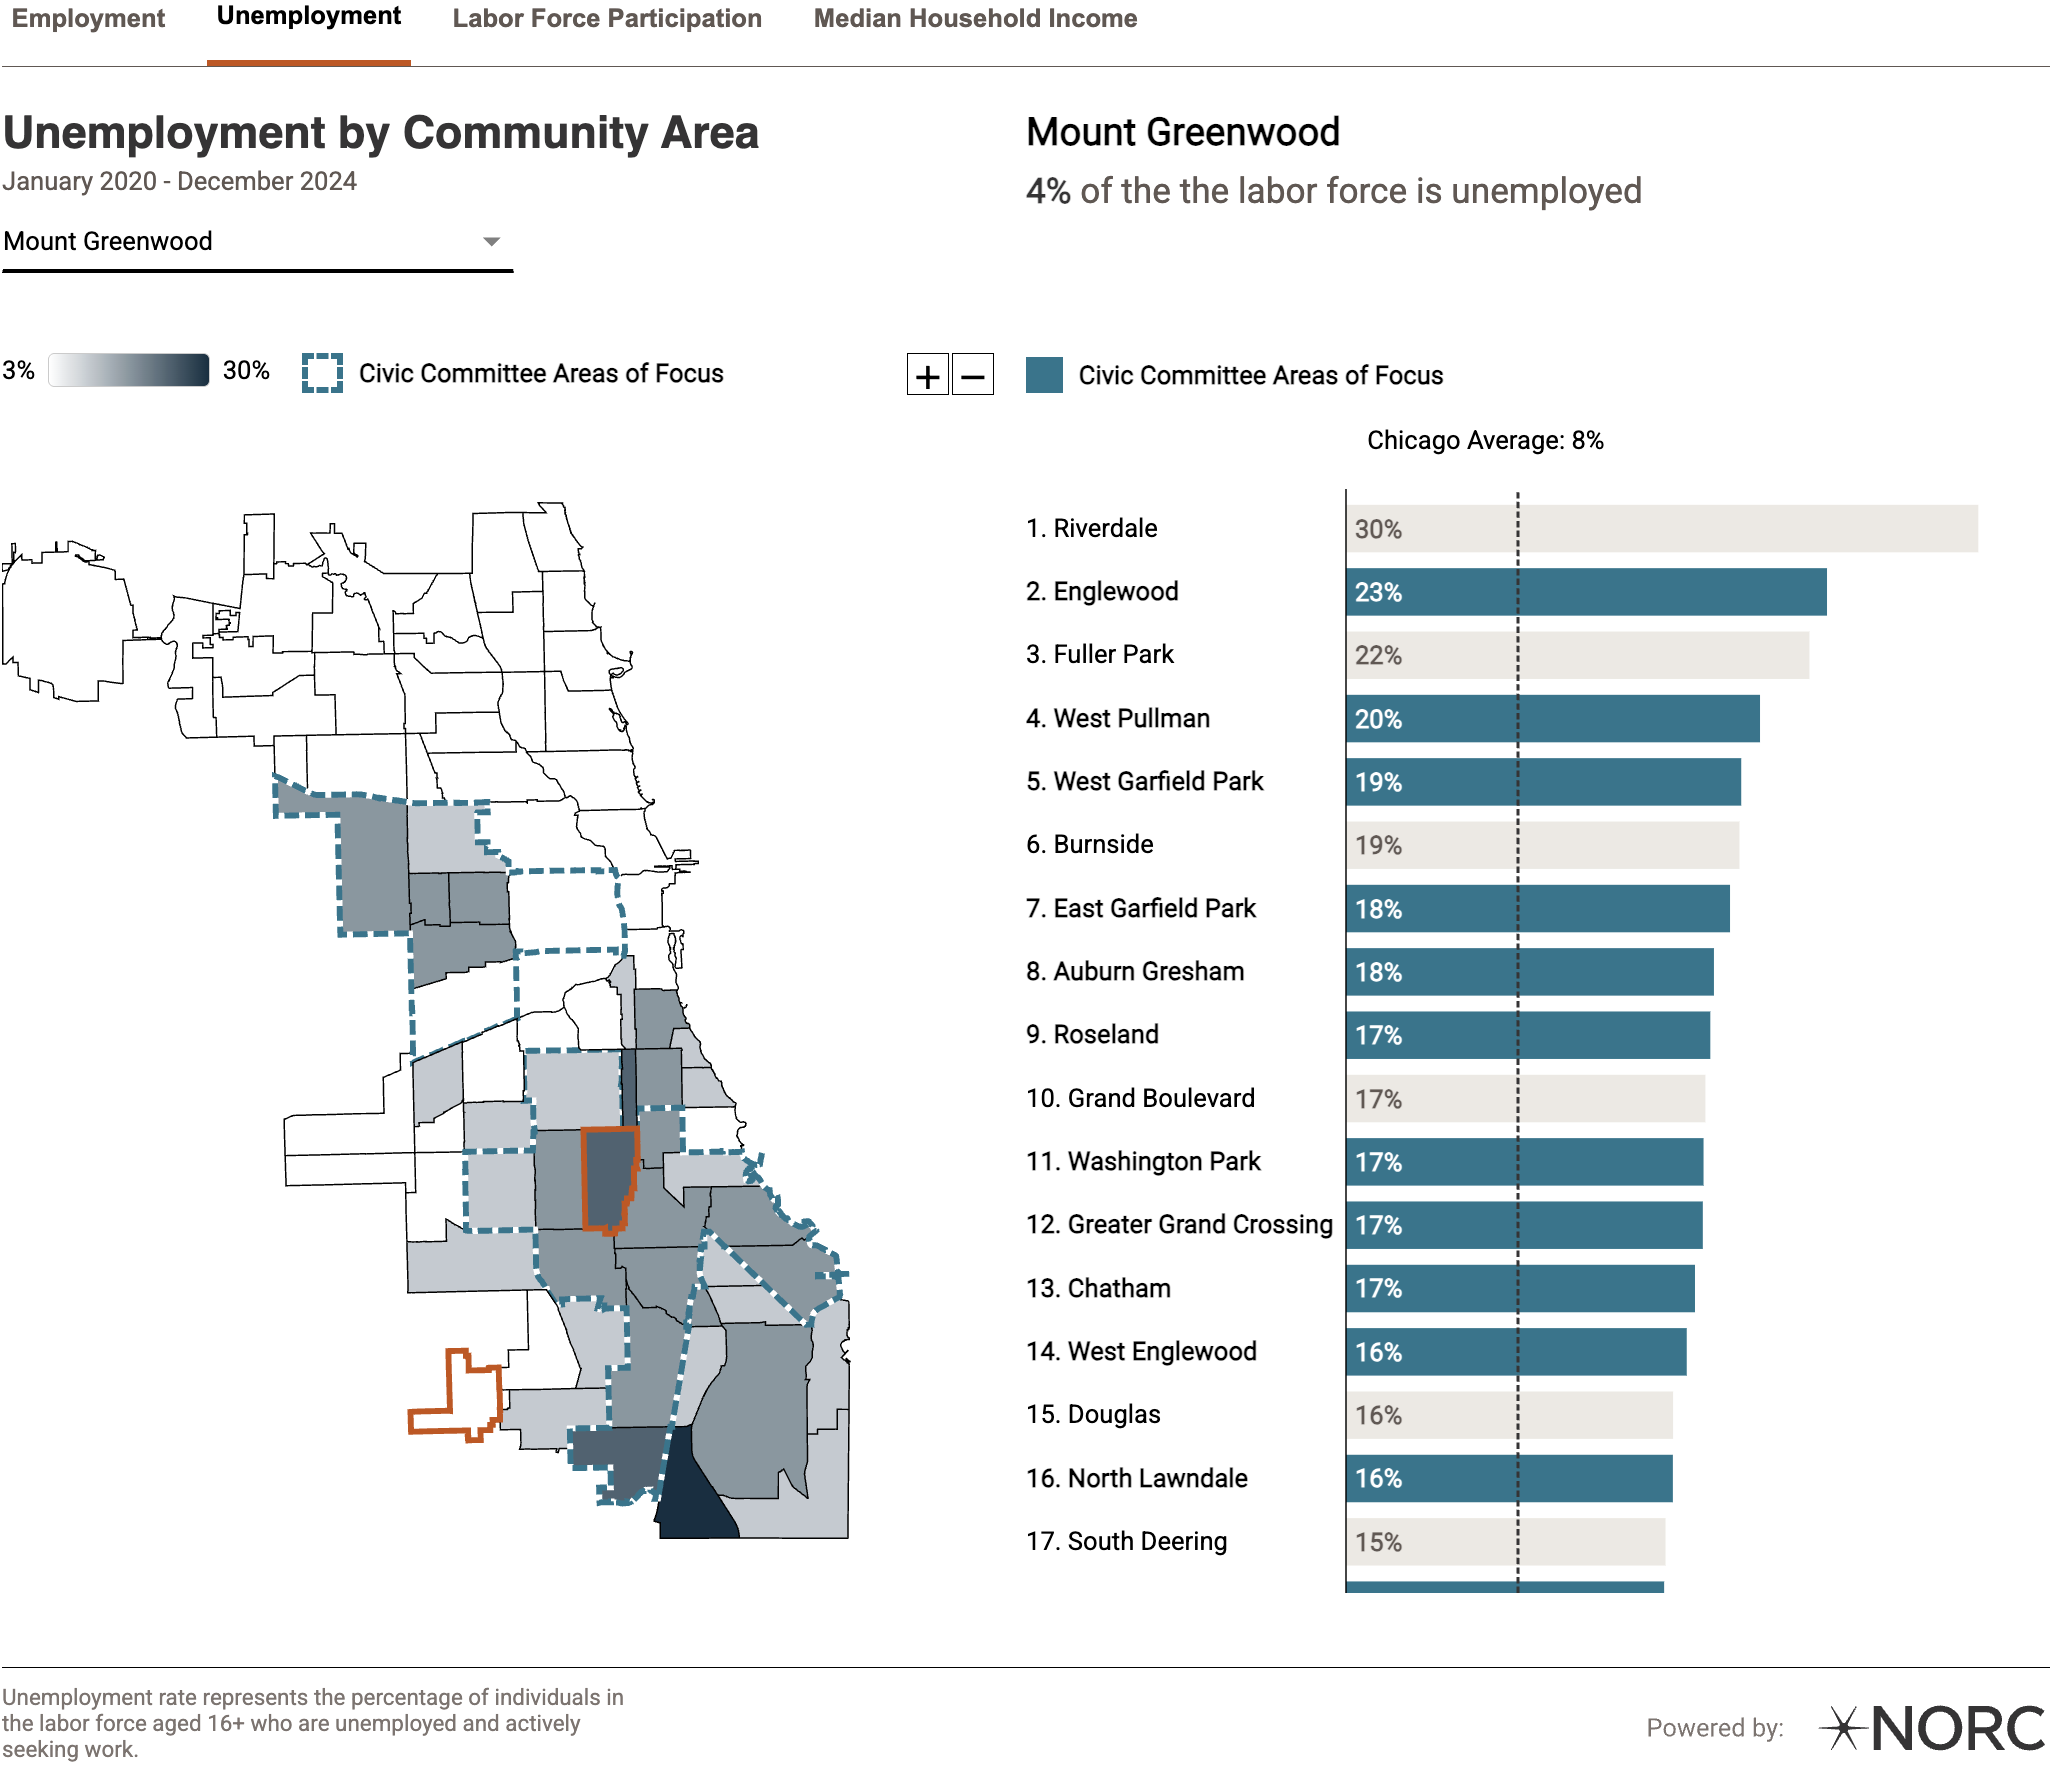
Figure 3. Screenshot of the Unemployment tab in the Community Impact Map.
When to use it: The unemployment rate can be used to analyze labor market tightness or the effectiveness of job-matching in communities where residents are actively seeking work. It’s the standard metric for tracking economic cycles and recession impacts.
Example: When designing workforce development programs, the unemployment rate helps target interventions to communities where residents are job-ready and actively searching but struggling to secure positions.
Why These Measures Matter
Together, these three metrics provide a nuanced look at Chicago’s economic landscape. The employment-population ratio tells us who is working, the unemployment rate tells us who is seeking work without success, and the labor force participation rate tells us who is connected to the labor market in the first place. Viewing them side by side—especially through mapped community area data—helps uncover both strengths and structural challenges that shape residents’ access to work.
For instance, a community might show low unemployment but also low participation, suggesting that residents have disengaged from the labor market entirely rather than simply struggling to find jobs.
All three indicators are updated using the latest ACS 5-year estimates and are now available in our interactive map. We hope these additions support deeper understanding, better decision-making, and more informed conversations about economic opportunity across Chicago neighborhoods, including how efforts to close the employment gaps across Community Areas may contribute to reducing gun violence in the city.
These measures are also important for understanding the opportunities to deploy an important deterrent to gun violence: jobs. The relationship between employment and involvement in gun violence is nuanced, and not as clean as politicians (and others) might hope. A job might not “stop a bullet” as easily as the saying goes, but jobs are important components of long-term community safety. And Chicago's private sector employers, who collectively account for nearly 90 percent of the jobs in the region, have a special role in creating employment opportunities. We’ll dig into this opportunity in another post coming soon!