
Block-Level Maps Give a More Accurate View of Where Crime Is Happening
Updates & Insights
View the latest changes to the DataHub and read commentary and analysis from our community of experts and contributors.
November 2026
Chicago’s 77 Community Areas are a familiar way to compare public safety conditions across the city.
But each one is made up of many blocks. Even in a Community Area with a high number of shootings, the experience is not the same on every block.
Research on crime and place has consistently found that crime concentrates in a small number of locations. The Chicago Public Safety DataHub is designed to make that pattern visible. Along with totals for larger areas such as Community Areas and police districts, the Trends Over Time map shows crime down to the block level, so users can see where incidents concentrate and where they don’t.
How to Conduct this Analysis
To get started, go to the Explore Trends Over Time page on the Chicago Public Safety DataHub. Select an indicator of interest. Then select Community Area, All of Chicago, and a time period of your choice. When finished, select Update Map. The resulting map will show total counts of your indicator of interest by Community Area for the period you selected, and the sparklines, which are a group of line charts beside the map, show the full monthly history back to 2019.
For this analysis, we look at the shooting victims indicator for the 12 months ending in August 2026. This indicator counts every person who was shot, whether or not they survived. The underlying data are updated frequently, so the same selections made today may produce different counts than those shown in this post’s visuals.
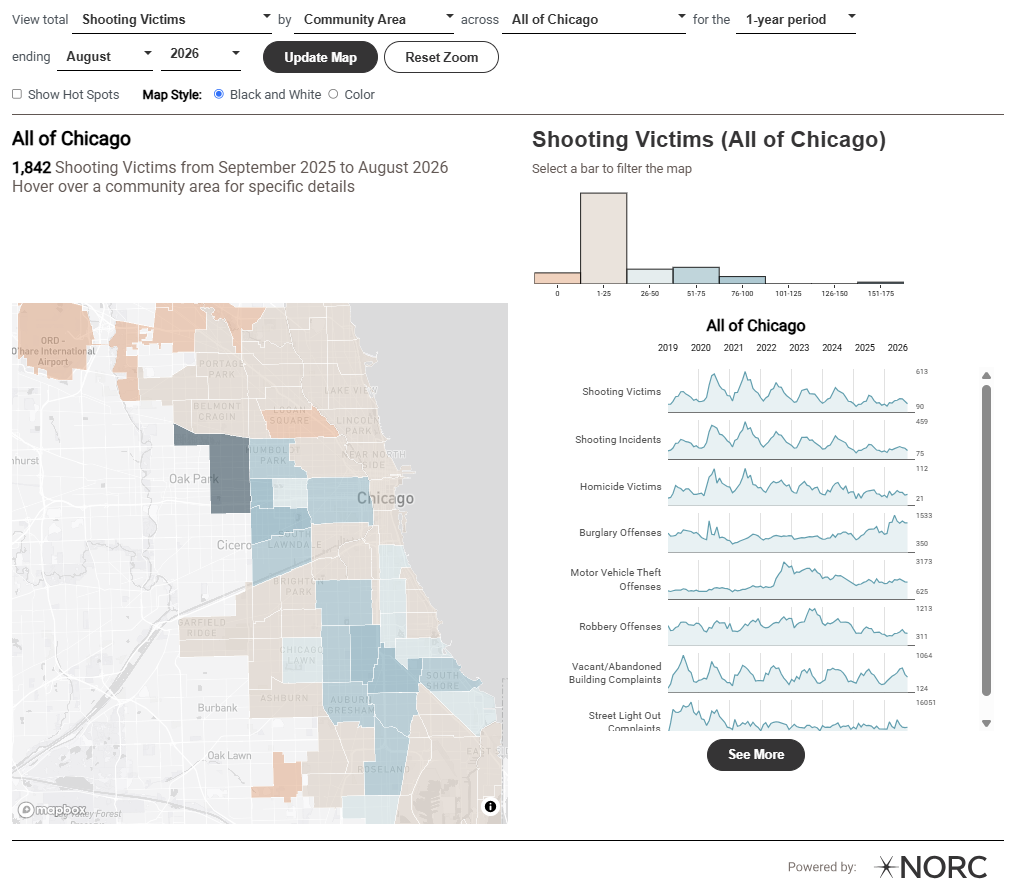
Zooming in shows whether a pattern holds across a Community Area or is driven by a few locations. To zoom in, click within the boundaries of a Community Area on the map to see counts by block group, then click within the boundaries of a block group to see counts by block.
Block groups are a Census Bureau geographical unit representing an area with around 1,500 residents. Blocks, the smallest Census Bureau geographic unit, are bounded by visible features such as streets, railroad tracks, and streams. Block populations can vary substantially. Some blocks are industrial areas or parks with few or no residents. Other blocks are mostly residential or mostly commercial.
What a Community Area Total Can Hide
Citywide, the map shows the highest counts of shooting victims in Community Areas on the South and West sides. That matches what many residents and public safety practitioners already know from experience, and at that scale, the picture is accurate.
But a Community Area total doesn’t show where within the area people were shot. The same total could reflect incidents spread across many blocks or concentrated on a handful of them. The same is true for other crime types.
A Closer Look at West Garfield Park
West Garfield Park had 95 shooting victims during this period, the third highest of Chicago’s 77 Community Areas. Without a detailed knowledge of the community, it would be easy to assume that those shootings affect the entire area roughly evenly. Breaking the data down into smaller areas shows a different picture. Clicking within the boundaries of West Garfield Park updates the map to show the count of shooting victims by block group.
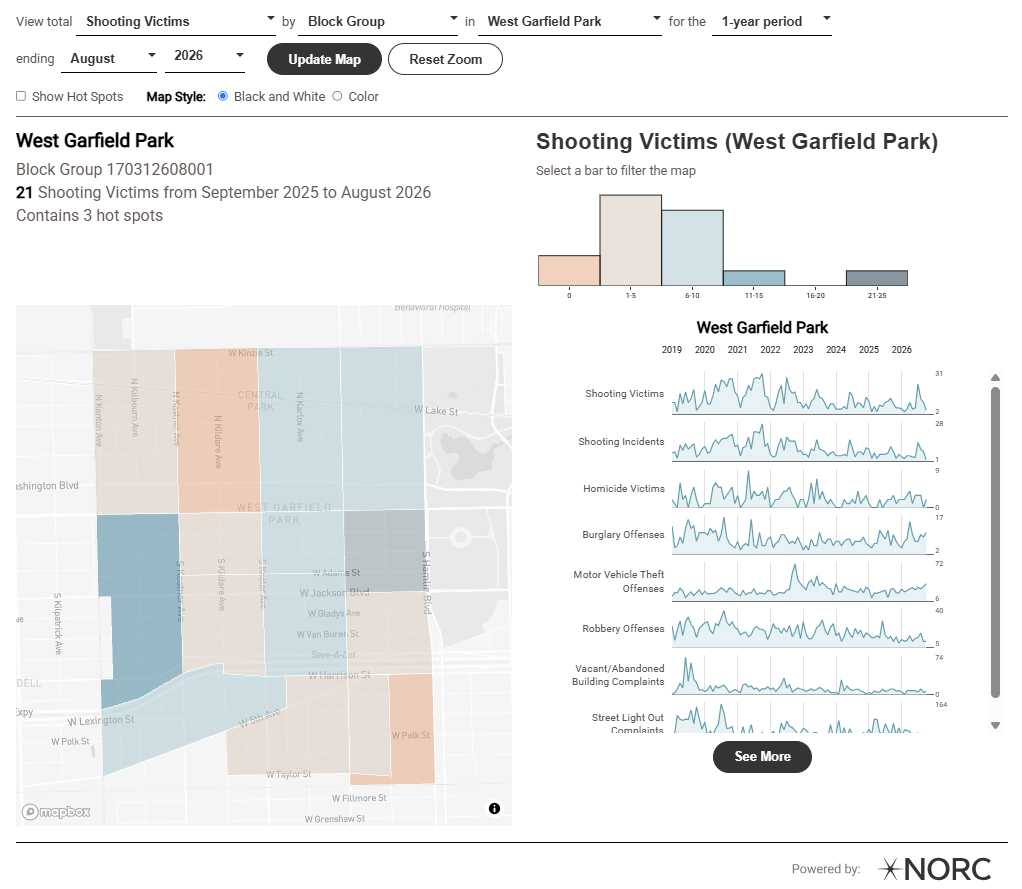
At this level, shooting victims are clearly not evenly distributed within West Garfield Park. Some block groups had no shooting victims during this period, while one had 21, the highest count in the Community Area. Even within that block group, the experience is not the same from block to block. Clicking within its boundaries switches the map to the block level and shows how those shooting victims were distributed.
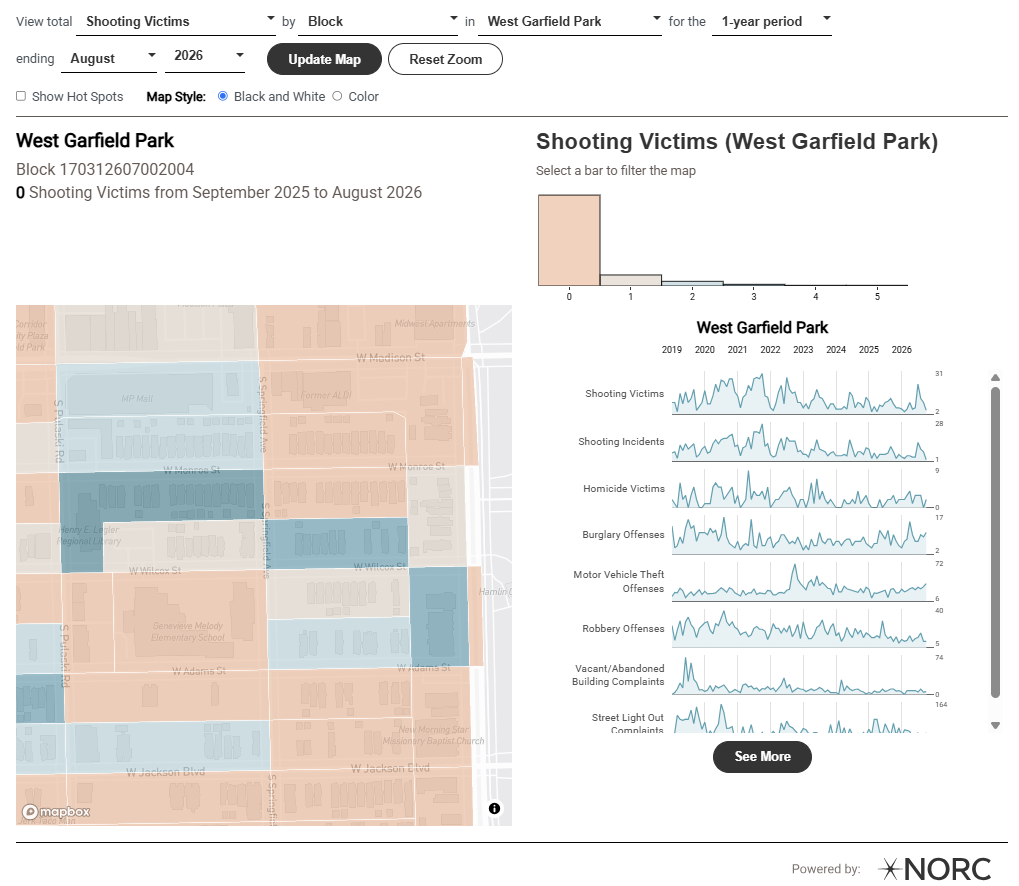
Of the 25 blocks in this block group, 15 had no shooting victims during this period, and seven had one or two. The remaining three blocks accounted for 10 of the block group’s 21 shooting victims, or 48 percent of the total.
What the Map Can and Can’t Tell Us
Seeing the data at this level of detail helps avoid treating an entire neighborhood as if every block faces the same conditions. It also shows where incidents are most concentrated, which is a useful starting point for asking what else is happening at those locations and what programs or services are already present. The same view can help frame conversations with residents about what they are experiencing.
The map can’t explain why gun violence concentrates where it does, and it can’t tell us whether a particular response is working. The data also reflect reported incidents, and records may be corrected or reclassified as investigations progress. The map can, however, point to where to look more closely and, over time, show whether the pattern on those blocks begins to change.
Bottom Line
Crime clusters by place, often more tightly than a Community Area total suggests. In West Garfield Park, shooting victims during this period were concentrated on a small number of blocks, and many nearby blocks recorded none. The DataHub’s flexibility in showing long or short time periods over several years of data also allows the user to assess whether crime tends to concentrate in the same small number of blocks over time. Seeing the data at that level gives a clearer starting point for understanding what is happening on those blocks and what residents there are experiencing.